

ETF Spot Flows: The True Driver Behind the Rally
Demand through spot ETFs constitutes the central pivot of this bullish configuration. Academic research on exchange-traded products shows that daily price variations often precede fund flows, creating a reflexive feedback loop once momentum is established. This mechanism perfectly matches the trend observed this quarter, where days showing several billion dollars in flows during previous upward phases have extended rallies, even for the Bitcoin.
Flow clusters, rather than isolated transactions, tend to maintain trend sustainability. Maintaining series of multi-day net inflows into US ETFs, combined with closures above $117,000, would reactivate the bullish phase and re-engage October’s price zone around $126,000. Conversely, outflow clusters would expose the market to a correction toward lower support zones.
| Indicator | Trigger to Watch | Implication | Source |
|---|---|---|---|
| US Spot ETF Net Flows | 3 to 5 consecutive days of inflows | Releases supply between $114,000 and $117,000, revisits ATH zone | Flow tracker |
| 25Δ Skew, DVOL | Skew becomes put-oriented while DVOL increases | Crash risk window, lower supports in play | Deribit |
| Realized Price Bands | Close below $107,000 | Air pocket toward $93,000–95,000 | Glassnode |
| Liquidity Depth | US depth thins during upswings | Increased volatility, greater slippage | Kaiko |
| Macro | Headlines on tariffs and inflation | Systematic deleveraging, ETF outflow clusters | Farside |
Accumulate Bitcoin via Bitget Before the Takeoff!
Bitcoin is approaching its major resistance around $114,000–117,000. Take advantage of this strategic opportunity to accumulate BTC on Bitget before the next major rally fueled by ETF flows.
💰 Get an exclusive bonus when buying your BTC on Bitget!

The $107,000 Support: Critical Defense Line
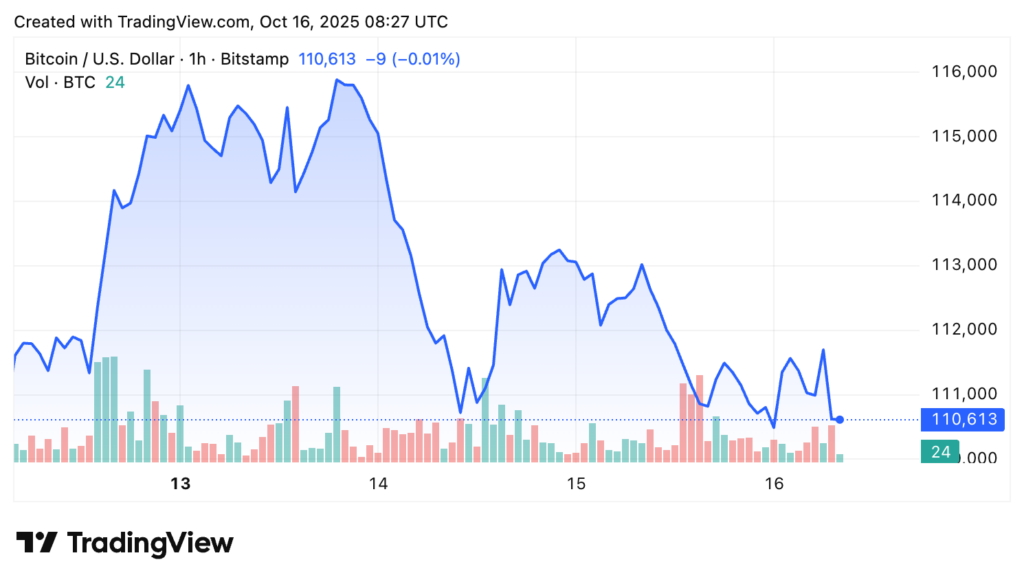
On-chain cost clusters locate a dense realized support zone between $107,000 and $109,000. This range represents the average acquisition price for a significant portion of current holders, making it a major psychological and technical level. Below this, a void appears toward $93,000 to $95,000 if this zone fails on a closing basis.
On-chain rotation shows distribution into strength: Long-term holders have increased their spending to new highs, a typical pattern at the end of impulse phases. Meanwhile, mid-range accumulation has improved with October’s surge, while ETF demand acted as the primary absorber of this selling pressure.
Above the spot market, supply from previous buyers tends to reappear around $114,000 to $117,000, where profit-taking has slowed advances in recent weeks. This zone therefore constitutes the next key resistance to overcome to validate a bullish continuation.
Bitcoin Between Stability and Leverage
The derivatives market presents a mix of leverage moderation and rising implied volatility. The 30-day DVOL index remains elevated and the 25 delta skew has alternated between call and put dominance, signaling periods of stress followed by rebounds. This leverage moderation reduces the risk of cascade deleveraging, paradoxically offering better stability in the face of sharp market movements.
The liquidity of US markets gives Bitcoin a structural advantage over altcoins. With deeper order books and the impact of ETFs, BTC better withstands macroeconomic shocks. Stablecoin flows project an additional demand capacity of $1 to $2 trillion by 2027, limiting extreme volatility risks and strengthening market resilience.
Macroeconomic risks, such as tariffs or stock volatility, remain the main source of uncertainty. Short-term fluctuations are amplified by these events, but maintaining above $107,000 and closures above $117,000 with multi-day ETF flows could reactivate bullish momentum. The evolution of skew and DVOL will serve as a barometer to anticipate whether the market stabilizes or experiences a disorderly fall.
On the same topic:

