

ADA Trapped Under Triple Moving Average Resistance
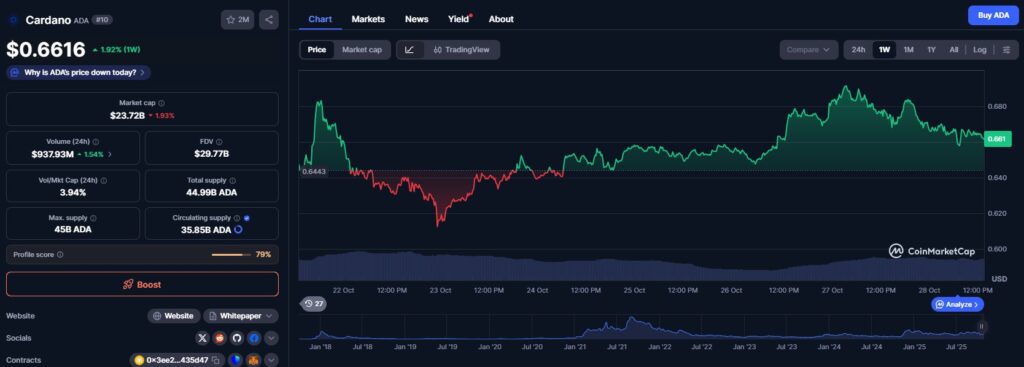
The daily chart of ADA displays a defensive technical configuration. The price currently trades at $0.66 USDT, below the 20-day EMA at $0.68, the 50-day EMA at $0.74, and the 200-day EMA at $0.77. This triple resistance configuration signals persistent selling pressure and limits the potential for an immediate rebound.
The RSI stagnates at 43.48, confirming the absence of bullish conviction. Buyers are struggling to take control, while sellers are not triggering a new wave of pressure either. The MACD remains just above its signal line with a microscopic positive histogram of 0.01, suggesting precarious stabilization rather than a genuine reversal.
The Bollinger Bands place Cardano midway between the upper band at $0.75 and the lower band at $0.58. This median position reflects a temporary equilibrium, often a precursor to volatility expansion in either direction. The daily ATR at 0.04 indicates contained movements, allowing traders to calibrate their stops with greater precision.
The daily pivot zone between $0.66 and $0.67 USDT constitutes the tactical battlefield of the week. As long as ADA remains trapped in this narrow band, any breakout attempt will be closely scrutinized by short-term operators.

Trading Scenarios for the Week: Range or Breakout?
Three technical configurations are emerging for the coming days. The primary bearish scenario would activate with a clear rejection below $0.66 USDT on a daily close. In this case, sellers would target the lower Bollinger Band at $0.58, representing a potential decline of approximately 13%. This scenario would be invalidated by a close above the 20-day EMA at $0.68.
The bullish scenario requires a confirmed breakout above $0.68 on the daily timeframe. Traders would then target the 50-day EMA near $0.74 and the upper band at $0.75, aiming for potential gains of 10–12%. A drop back below the $0.66 USDT pivot would invalidate this move.
The range scenario, currently the most probable, keeps ADA in compression between $0.66 and $0.68. Mean-reversion strategies dominate this type of environment, with quick profit-taking around the middle of the Bollinger Bands at $0.67. The compressed volatility measured by the ATR calls for disciplined position sizing and tight stops.
On lower timeframes (H1 and M15), the EMAs are interwoven around $0.66-0.67, confirming intraday indecision. The H1 RSI at 44.98 and the flat MACD reinforce this short-term neutral reading.
On the same subject:

