

The Macro Context: Trump, the EU, and a “Risk-Off” Market
The macroeconomic climate has darkened sharply over the past 24 hours. The announcement by President Trump of new punitive tariffs against several European Union countries has sent shockwaves through financial markets. Bitcoin (BTC), often correlated with risk-on assets, has not been spared, recording a drop of nearly 2.5% to touch $92,663.
This correction comes as the market is still digesting massive liquidations of long positions—over $680 million wiped out in a single day. Investors appear to be retreating to cash and gold, temporarily abandoning digital assets. However, the current decline could be the prelude to a deeper move, justified by five worrying technical signals.
The Formidable “Kumo Twist” on the Weekly Chart
This is arguably the most closely watched technical signal by Ichimoku traders. A bearish “Kumo Twist” is forming on the weekly timeframe. This phenomenon occurs when the two leading lines of the Ichimoku cloud (Senkou Span A and B) cross, indicating a potential reversal of the underlying trend.
Historically, this signal should not be taken lightly. During previous cycles, similar twists have preceded brutal corrective phases, sometimes leading to drawdowns of up to 60 or 70%. If this signal confirms on the weekly close, it would validate a transition from a bullish structure to bear dominance.
The Break of the 365-Day Moving Average
Another pillar of long-term technical analysis: the 365-day moving average. This indicator often acts as the ultimate line of demarcation between a Bull Run and a Bear Market. For the first time since early 2022, Bitcoin’s price threatens to settle durably below this critical level.
A confirmed break of this dynamic support suggests that the underlying trend, which has carried the market for two years, is broken. As long as the price does not move back above this average with volume, any bounce risks being considered a “Dead Cat Bounce” before another bearish leg.
Critical Divergence Between Price and Demand
On-chain data reveals a structural anomaly: while BTC’s price remains historically elevated (close to $90k-100k), actual demand is collapsing. The “visible demand” indicator shows that new buyers are becoming scarce.
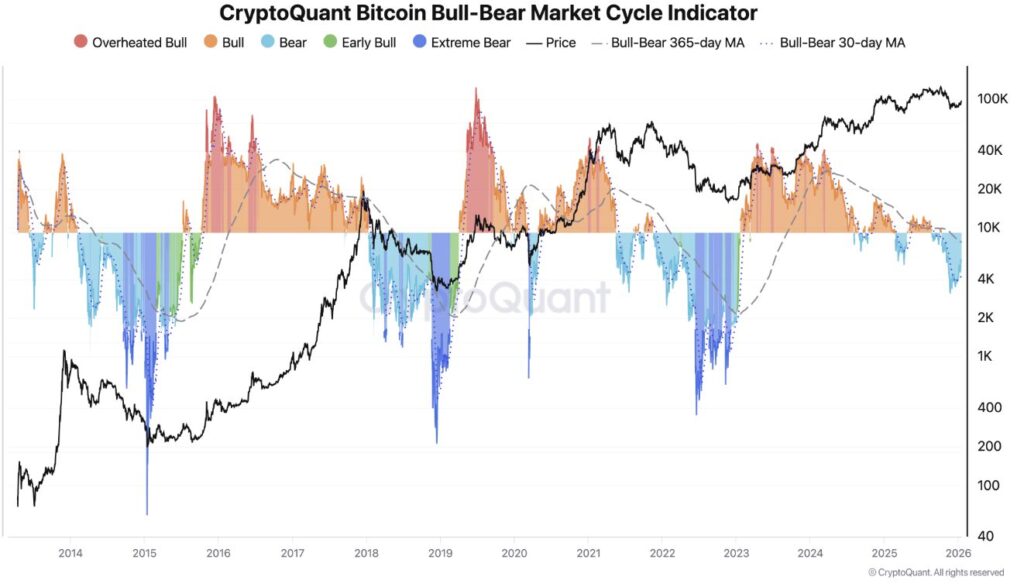
This divergence is typical of distribution phases. The market rises or stagnates thanks to inertia and leverage, but without fresh capital flows (Spot) to support prices. When this divergence reaches its peak, the market often corrects violently to find a price level where organic demand reappears. For now, Bitcoin is still firmly in bear market territory.
ETFs and Liquidity: Is the Engine Stalling?
The fourth signal concerns institutional flows. The American Spot Bitcoin ETFs, which have been the main driver of the rally in 2024 and 2025, are showing worrying signs of exhaustion. After accelerating in late 2025, net inflows are slowing considerably, even reversing on certain days.
Finally, overall crypto market liquidity is contracting. Altcoins, being more volatile, suffer more from this liquidity withdrawal, making the market particularly vulnerable to liquidation cascades. Without institutional support via ETFs, Bitcoin finds itself exposed to retail trader nervousness and macroeconomic shocks.
Will the $90,000 Support Hold?
The convergence of these five signals—Kumo Twist, break of the 365MA, demand divergence, ETF fatigue, and liquidity crisis—paints a cautious picture for late January 2026. The $90,000 level now appears as the last psychological and technical rampart before a potential bearish acceleration toward the $80,000 zone. The bullish trendline increases the chances of Bitcoin returning to the order block and POC at $87,000 while numerous longs are to be liquidated below.
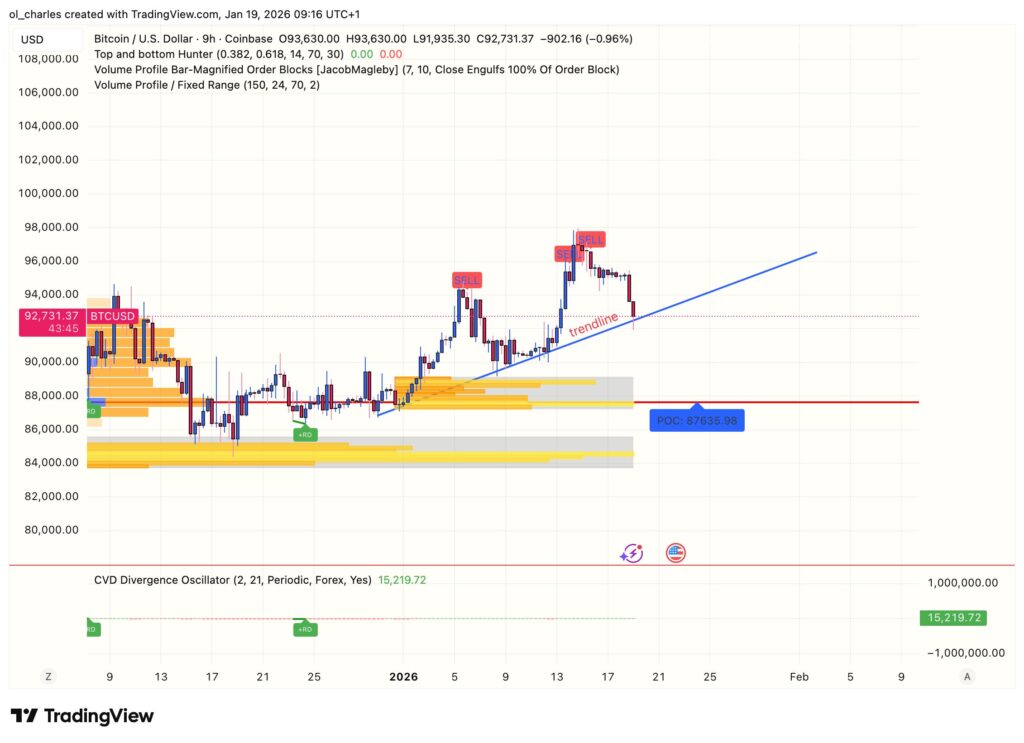
However, the crypto market remains unpredictable. A geopolitical détente or a surprise announcement from a central bank could invalidate this bearish scenario. Traders will closely monitor the weekly close: can Bitcoin save its trend or are we officially entering the crypto winter of 2026?
Related Articles:

