

A Technical Structure Reminiscent of the 2022 Bear Market
The cryptocurrency market is going through a period of uncertainty, and Bitcoin (BTC) holders might need to hold on tight. Indeed, the current BTC price structure shows striking similarities with the 2022 bearish cycle. Far from the V-shaped recovery hoped for by investors, the king of crypto seems to be settling into a prolonged bearish trend.
Technical indicators are not yet showing signs of an imminent bullish reversal. On the contrary, weak buying volumes and persistent selling pressure suggest that the market has not yet fully purged the excesses. This configuration points to a continuation of the current correction, invalidating for now the scenarios of an immediate breakout toward new highs.
If this forecast is confirmed, Bitcoin could be forming a classic bull trap, where each rebound attempt is quickly sold by whales and institutional traders. Caution is therefore warranted, as history shows that BTC tends to test investors’ resilience to the breaking point before initiating a genuine bull run.
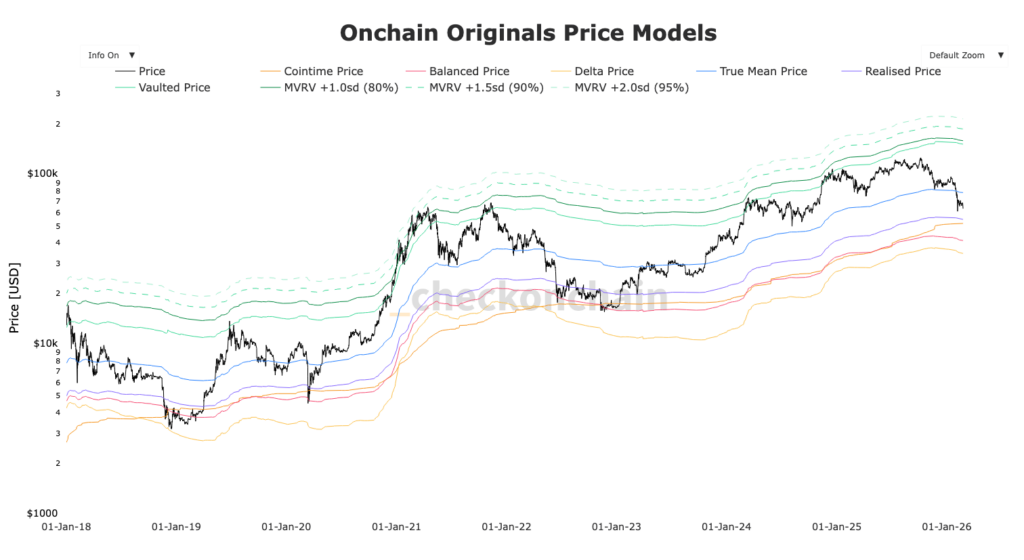
From an on-chain perspective, the next support levels for BTC are as follows:
- Realized Price at $54,000: The average purchase price of investors. Below this level, the majority of holders are in the red.
- Cointime price at $51,000: Average cost weighted by active economic time (a “true” and adjusted version of the realized price via Cointime Economics, closer to the cost basis of active investors).
- Balanced price at $41,000: Realized price – transferred price (historically “paid” value minus “spent” value, often seen as a fair value level or floor at the end of a bear market).
- Delta Price at $34,000: Realized price – historical average price (hybrid on-chain/technical model that often captures bear market bottoms).
How Far Can the Purge Go? Key Levels to Watch
The figure that makes the crypto community tremble has been dropped: $30,000. According to analyst Rashad Hajiyev, Bitcoin could not only revisit this psychological level but potentially break this support to hunt for liquidity lower. Such a move would constitute a massive retracement, erasing a large portion of the gains accumulated during previous phases.
Technically, a drop below $30,000 would fill certain market inefficiency zones and test crucial historical supports. If the price were to collapse below this threshold, it could trigger a cascade of liquidations in derivatives markets, accelerating the short-term decline before stabilizing the price for a sideways accumulation phase.
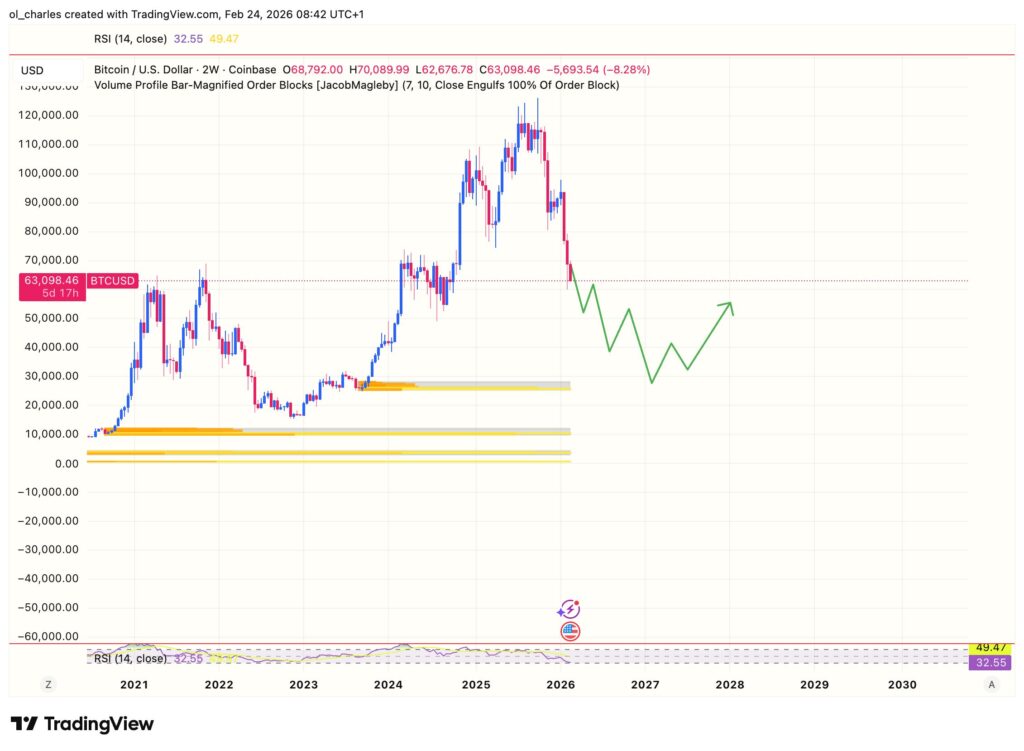
Furthermore, Bitcoin shows a 2-week Order Block between $25,000 and $27,000, which would be an optimal zone for a rebound and demand influx if this bearish scenario materializes.
The crypto market has accustomed us to spectacular reversals. A favorable macroeconomic event or major institutional announcement could invalidate this bearish thesis and propel Bitcoin toward a surprise rally. Traders will therefore closely monitor the price reaction at intermediate supports. Will Bitcoin defend its current zone or yield to selling pressure to offer a golden entry point for patient investors?
Related Articles:

