

Bitcoin: The “No-Top” Cycle That Could Change Everything in 2026
Bitcoin continues to struggle to maintain its momentum. Stuck below the psychological resistance of $72,000, the king of cryptos faces persistent selling pressure that stifles every rally attempt. As we reach mid-February 2026, the market seems to hesitate between capitulation and accumulation, leaving investors in limbo. The bulls’ inability to regain control worries analysts, who now warn that a break below $60,000 is an increasingly credible scenario.
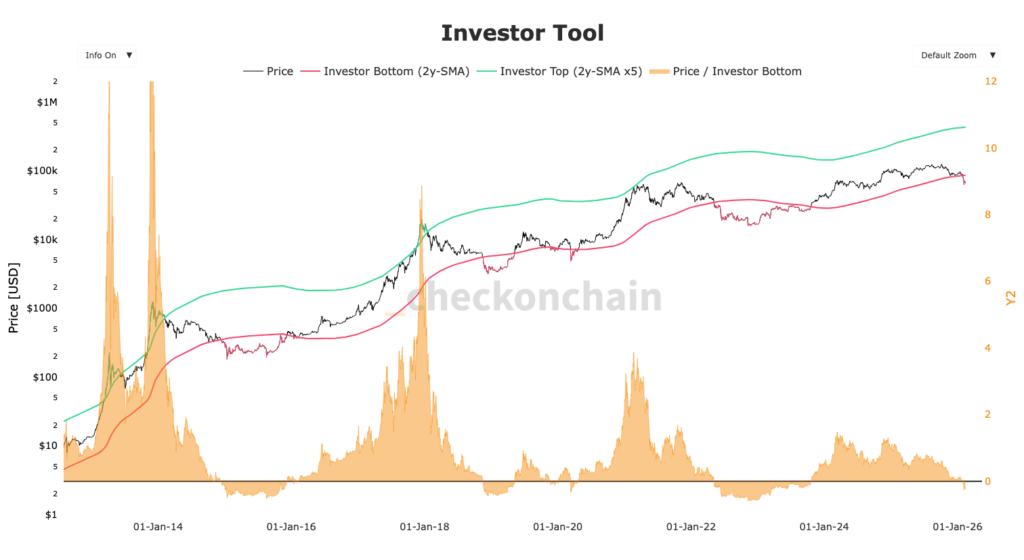
But beyond short-term volatility, one theory is gaining traction: the “no-ceiling cycle.” Unlike previous cycles marked by excessive euphoria, the late 2025 peak (around $126,000) didn’t deliver the expected fireworks. This “missing” top could paradoxically cushion the current decline, thus redefining the depth of the 2026 Bear Market.
A “Truncated” Top That Disrupts Historical Models
Bitcoin history has accustomed us to binary cycles: a vertical (parabolic) explosion followed by a brutal 80% crash. However, the 2024-2025 cycle defied predictions. While the new ATH (All-Time High) was indeed reached, it wasn’t accompanied by the speculative frenzy typical of a “blow-off top.” This absence of euphoric ceiling suggests the market didn’t reach its usual overheating level, which could theoretically limit the severity of the current retracement.
On-chain analysts emphasize that the market structure is different. Liquidity, while scarcer in recent weeks, hasn’t evaporated like in 2018 or 2022. The “no-ceiling cycle” concept implies that without massive upside excess, the downward correction (the bottom) could be less deep than the -85% feared by purists. We could witness a softer landing, where price oscillates in a broad distribution zone rather than collapsing vertically.
However, this atypical structure traps many traders. The absence of clear end-of-cycle signals left many investors exposed, waiting for a final bullish leg that never came. Today, the market must digest this unrealized excess optimism, which explains the slowness and painfulness of the current correction.
$60,000: The Last Bastion Before Capitulation?
Technically, the situation is tightening. The $60,000 level is identified by most chartists as the critical support that must be defended at all costs. A weekly close below this threshold would validate a long-term bearish structure, opening the door to a drop toward the $48,000 – $52,000 liquidity zone below the Realized price at $54,000. Volatility has spiked in recent days, a sign that weak hands are beginning to let go in the face of uncertainty.
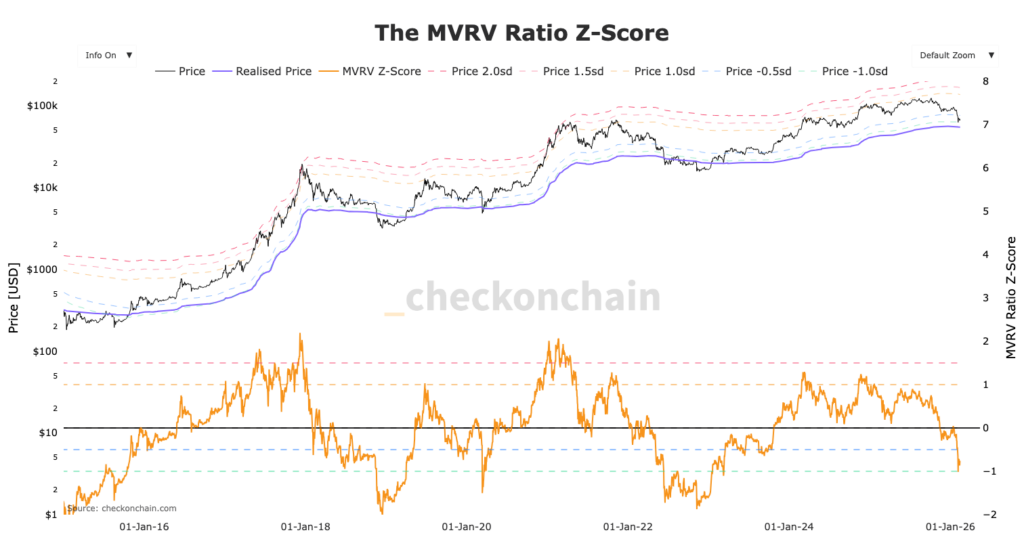
Recent data also shows liquidity drying up in order books, making price more sensitive to whale movements. If macroeconomic conditions don’t improve quickly, the risk of a flash crash to hunt stops below $60k is real. It’s often in these zones of maximum pain that true market bottoms form.
Related Articles:

