

A Technical Indicator That Rarely Misleads Over the Long Term
The MACD, or Moving Average Convergence Divergence, ranks among the most reliable technical analysis tools for assessing an asset’s momentum. Unlike short-term indicators often obscured by market noise, the monthly MACD offers a macro view of the underlying trend. Its shift to red occurs when the MACD line crosses below the signal line, indicating a weakening of buying pressure against selling pressure for Bitcoin.
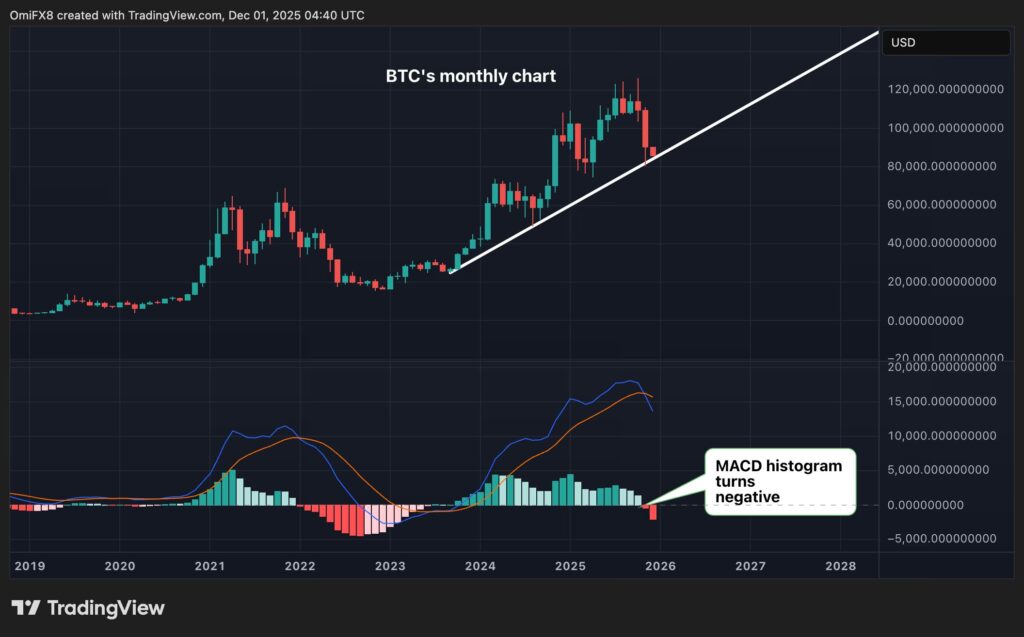
For Bitcoin, this monthly shift carries particular significance. Historically, the rare occasions when this indicator turned red have preceded or accompanied major corrections. In 2018, this signal appeared a few months after the $20,000 peak, foreshadowing a drop to $3,200. In 2021-2022, the monthly MACD also turned negative, announcing the bear market that saw BTC fall below $16,000.
The monthly nature of this indicator gives it substantial inertia. A reversal at this scale typically doesn’t correct itself within a few weeks. Experienced traders know that a red monthly MACD suggests a period of bearish volatility that can extend over several months, even if technical rebounds remain possible in the short term.
What Can Investors Expect in This Context?
Faced with this technical signal, strategies diverge within the crypto community. Long-term holders, accustomed to Bitcoin’s four-year cycles, often view these correction phases as accumulation opportunities. Their thesis rests on fundamentals: growing adoption, programmed scarcity via halvings, and BTC’s positioning as a digital store of value.

Active traders, however, adjust their positions accordingly. Many are increasing their cash levels, reducing leverage exposure, or placing sell orders at resistance to lock in gains. A red monthly MACD doesn’t constitute a panic sell order, but rather a signal for heightened caution in risk management.
The bearish volatility signaled by this reversal doesn’t necessarily mean an immediate collapse. Bitcoin may well range for several weeks, alternating between distribution phases and rebound attempts. Key support levels, particularly the 200-week moving average, become critical zones to monitor closely for anticipating significant moves.
Bitcoin: Technical Analysis Alone Isn’t Enough
While the monthly MACD constitutes a serious indicator, it should never be used in isolation. Current macroeconomic conditions, central bank monetary policies, institutional flows into Bitcoin ETFs, and general crypto market sentiment all play a crucial role in price formation.
The current environment differs significantly from previous cycles. The approval of spot Bitcoin ETFs in the United States has altered market structure by introducing more stable institutional flows. Trading volumes, order book depth, and the maturity of crypto infrastructure have also evolved, potentially dampening correction amplitude compared to past cycles.
Savvy investors therefore combine technical analysis with fundamental and macro context reading. A red monthly MACD remains a warning to take seriously, but not a definitive verdict. In a market as dynamic as cryptocurrencies, adaptability and rigorous risk management trump absolute certainties.
Ledger x Black Friday: An Unmissable Limited-Time Offer!
Secure your crypto on a Ledger now by taking advantage of this exceptional limited-time Black Friday offer. 50% off and up to $90 in rewards!

Related articles:

