

Bitcoin drops again amid tensions between Trump and Iran
The crypto market is currently deep in the red. Trading around $68,800 with a drop of approximately 3.9% over the last 24 hours, Bitcoin is taking the full brunt of global geopolitical shockwaves. As the war enters its fifth week with no clear resolution in sight, Donald Trump’s decision to extend the deadline granted to Iran is keeping extreme pressure on risk assets.
This risk aversion has triggered a short term selloff, dragging all altcoins down in its wake. The drop in equities, including the S&P 500, has prompted investors to pull back from risk assets such as cryptocurrencies.
Is Bitcoin’s key support in danger?
From a technical analysis standpoint, the temporary loss of the $68,500 level is a warning sign. This threshold had been acting as a major psychological and technical support for several weeks. By slipping below this zone, BTC is exposed to a deeper retracement, with the next safety net identified around $65,000.
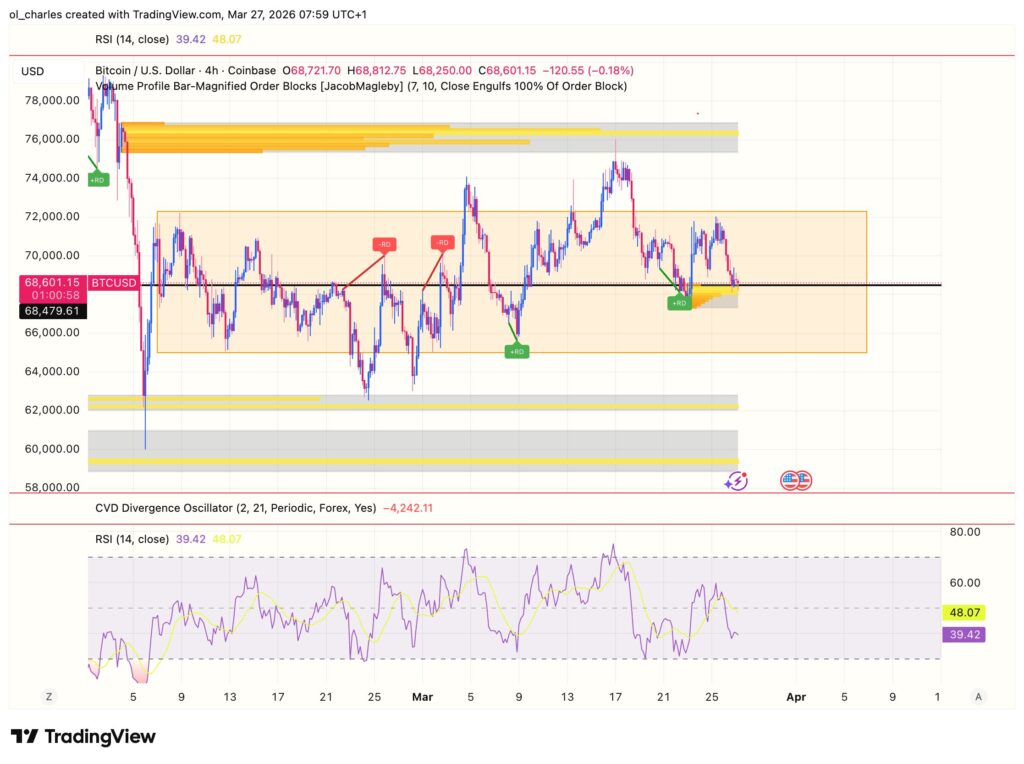
Indeed, $68,500 represents the mid range for Bitcoin and a 4 hour order block (a liquidity zone protected by smart money). It is therefore an ideal area for a bounce. In the event of a rebound, Bitcoin could potentially retest the top of its range at $72,000 and even the upper boundary of its bearish flag around $78,000.
Selling pressure seems to be running out of steam in the short term. The RSI hit its oversold territory on the 4H chart last week, but has not yet reached the overbought zone. If sellers fail to drive the nail in, a bullish move could quickly bring the price back to test the former $70,000 resistance in the coming days.
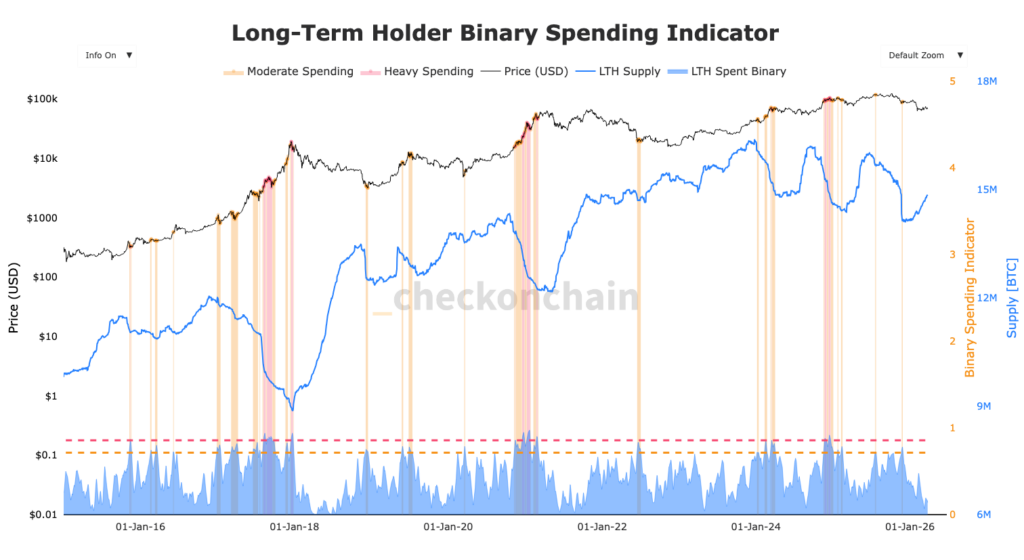
Furthermore, long term holders continue to accumulate at this level. This dichotomy between short term market sentiment and long term fundamentals is typical of consolidation phases. Less experienced investors are capitulating in the face of macroeconomic uncertainties, while smart money is quietly positioning itself for the next rally.
The bearish scenario: Heading toward $65,000 or $57,000?
Nevertheless, the market is not immune to new macroeconomic developments that could drag the S&P 500 even lower. If BTC closes its weekly candle below $67,700, it would be a red flag pushing BTC toward $65,000 at the very least.
Losing $65,000 would drag BTC below $60,000 in the following weeks or months. According to trader Killa, this scenario could take 1 to 3 months to materialize, and Bitcoin will experience numerous bounces along the way.
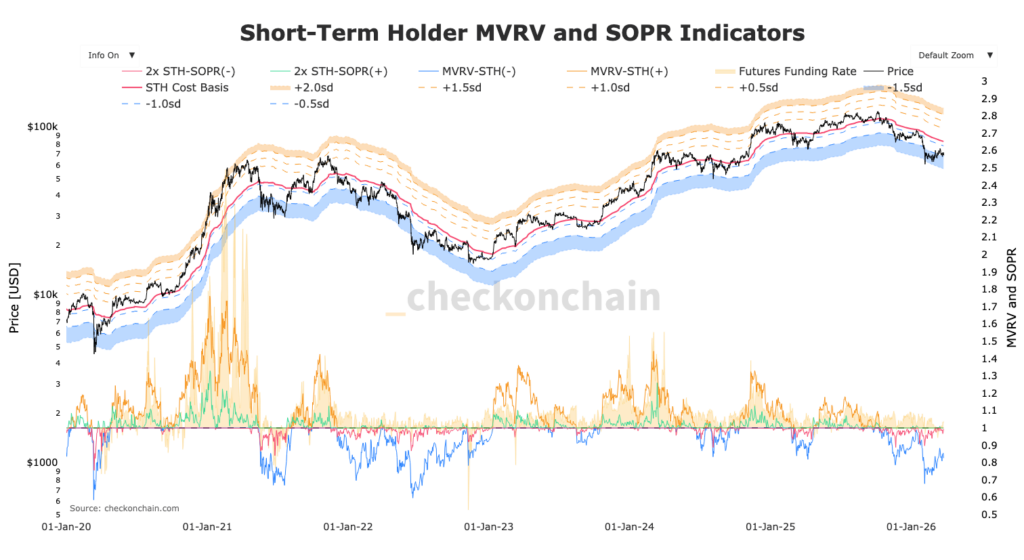
The STH MVRV chart (the average purchase price of short term holders) indicates a bottom around $57,000 in the event of a drop in the coming weeks.
Is it a good time to buy Bitcoin?
Faced with this complex geopolitical environment, traders find themselves at a crossroads. On one hand, the risk of military escalation in the Middle East could trigger a new wave of liquidations, pushing Bitcoin down to $65,000 or $57,000. On the other hand, institutional accumulation suggests that a solid bottom is currently forming.
If the price manages to stabilize and turn the $68,500 zone into a new springboard, we could witness a surprise rally toward $78,000 or $85,000. The coming days will be absolutely decisive: the market will wait to see if buyers have enough strength and liquidity to absorb the current selling pressure. But above all, it will be watching how the stock market reacts, as it seems to be pointing toward a prolonged decline.
Sources:
Related Articles:

