

Explosive Technical Pattern Approaching for Bitcoin
Recent technical analysis indicates a possible imminent breakout for Bitcoin (BTC) toward new heights. The digital currency has recently oscillated around $118,000. It currently finds itself at a crucial point, ready to break out of a triangular pattern.
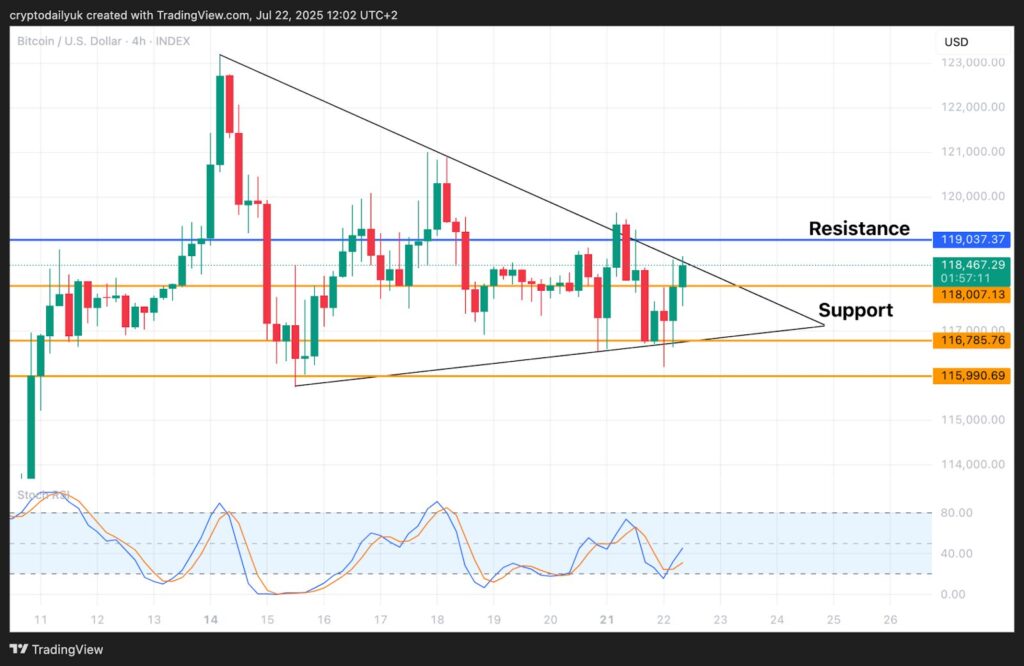
Ascending triangles typically end with a breakout, and we seem to be approaching this critical point. If bulls take control, new highs could be reached. We note targets at $119,000, $119,640, and ultimately $121,000, before aiming for the all-time high of $123,200.
However, if bears gain the upper hand, a pullback below $116,000 could trigger a rapid decline toward $112,000. A drop below $109,000 would raise major concerns about the trend.
From a technical perspective, the weekly chart shows solid support around $119,000. Consolidation at this level could signal a new bullish cycle, with a potential target of $130,000. In case of a pullback, the price structure formed by the peaks of the descending wedge and the bullish pennant could act as reliable support, inducing a rebound.
RSI Sends a Strong Message to Bulls
The RSI indicator on the biweekly chart points to a possible trend breakout. A push toward $130,000 could not only confirm this breakout but also invalidate a bearish divergence. This would pave the way for new highs. However, confirmation is needed in the coming weeks to validate this hypothesis.
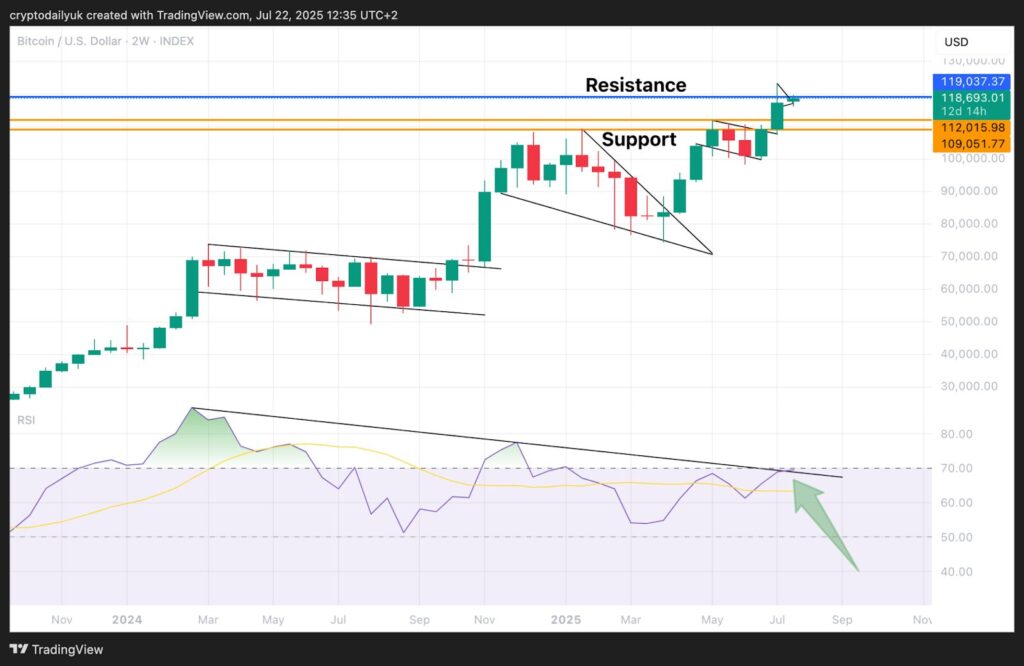
Technical signals seem to indicate an imminent Bitcoin (BTC) breakout, with significant upside potential in the coming weeks. However, investors will need to remain patient and vigilant, as a sharp pullback remains possible. By staying attuned to key support and resistance levels, traders can seize opportunities offered by this vibrant market.

