

Bitcoin in a Zone of Uncertainty
Bitcoin is currently navigating through a zone of uncertainty marked by persistent selling pressure since October’s brutal correction. Despite this downward momentum, on-chain data reveals a subtle yet significant shift in market structure. The volatility that exploded during the crash is finally beginning to subside on the daily timeframe. This gradual cooling suggests that erratic movements are coming to an end and a more stable consolidation phase is taking hold.
CryptoQuant data shows that the volatility slope has begun a notable decline. This decrease is not insignificant: it typically indicates that the market is digesting recent shocks and excessive speculative positions are unwinding. Professional traders know that flattening volatility after a period of intense stress often precedes a major impulse movement, whether bullish or bearish.
The macroeconomic context remains a determining factor. US Treasury yields continue to fluctuate, geopolitical tensions persist, and institutional investors continue to arbitrage between risk assets and safe havens. This complex configuration keeps market sentiment in a neutral zone where long-term holders demonstrate resilience while short-term traders take profits cautiously.
Short Squeeze Mechanics in Preparation
Renowned analyst Axel Adler identifies in this stabilization phase the early signs of a potential short squeeze. The mechanism is classic: when volatility decreases after a correction, short positions accumulated during the decline become vulnerable. If the price begins to rise with conviction, these short sellers are forced to buy back their positions to limit losses, creating a cascading buying pressure that amplifies the upward movement.
Liquidation data shows that significant concentrations of shorts are positioned between $112,000 and $115,000. A clean break above these levels could trigger a chain reaction where forced liquidations propel Bitcoin toward the $117,500 to $120,000 zone. This scenario has occurred multiple times in BTC’s history, particularly after prolonged consolidation phases following violent crashes.
Adler, however, cautions against excessive optimism. The short squeeze will materialize only if the macroeconomic environment remains stable. A sharp rise in US bond yields or a strengthening dollar could instantly reverse market sentiment toward risk-off, forcing capital to flee volatile assets like Bitcoin in favor of safer investments.
Buy your Bitcoin on Bitget and receive $10 bonus with just a few clicks right now:

Technical Analysis: Bitcoin Between Support and Resistance
On a purely technical level, Bitcoin is trading around $111,526 in a lateral range structure. The daily chart shows that the 50-day moving average now acts as a dynamic resistance, repeatedly rejecting rebound attempts. This MA50 constitutes the first major obstacle to overcome to validate a bullish reversal.
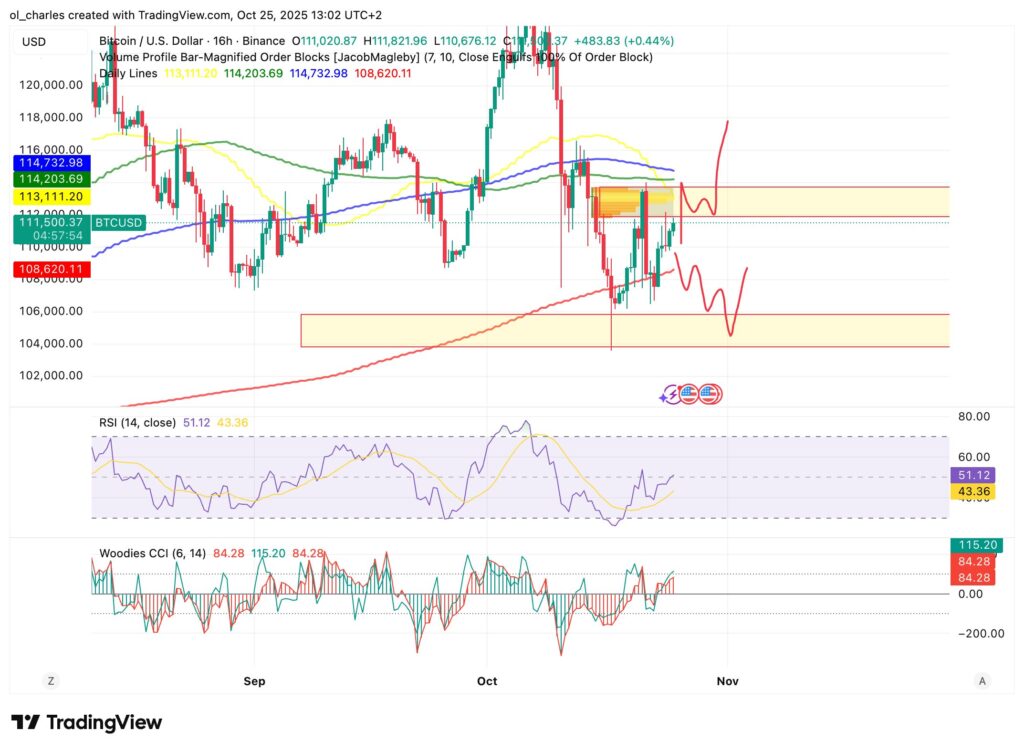
Critical support lies between $108,000 and $106,000, a zone that coincides with the 200-day moving average. This level has held strong during recent selling pressures and represents an important psychological defense line. A break below would confirm a bearish continuation toward $105,000 at minimum, while maintaining above preserves the chances of recovery.
For the bulls to regain control, a daily close above $113,000 accompanied by significant volume would be necessary. This breakout would open the path toward retesting resistance at $117,500, a level where substantial liquidity is concentrated. Momentum indicators remain neutral, reflecting the current market indecision waiting for a decisive catalyst to break out of this range.
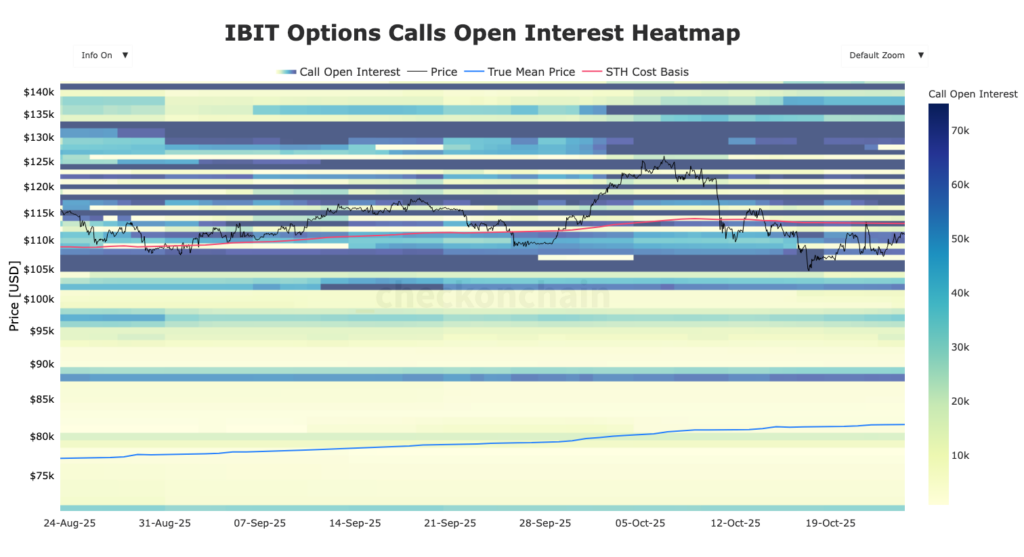
Nevertheless, the zone between $112,000 and $113,800 remains a solid wall to overcome. Moreover, $113,000 corresponds to the average purchase price of short-term Bitcoin ETF buyers. This is a crucial level as IBIT Bitcoin ETF holders tend to panic below these prices and take profits above this threshold.
On the same topic:

