

An imminent breakout setup for the memecoin
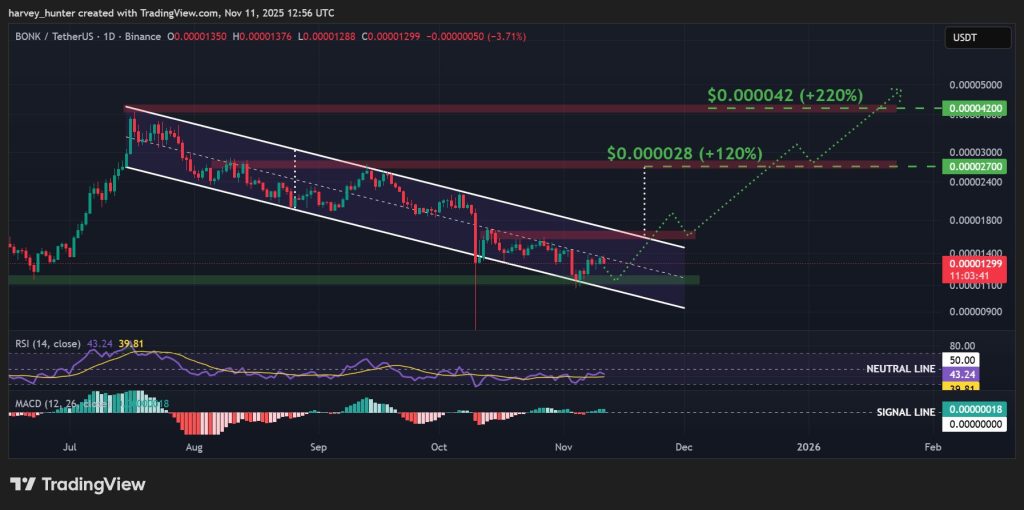
The daily chart of BONK currently presents a particularly promising technical configuration. The token has been evolving for four months within a descending triangle, a classic consolidation pattern that often precedes violent directional movements. The distinctive feature here lies in the fact that the lower boundary of this triangle has repeatedly served as a bullish springboard, confirming its role as a strategic accumulation zone.
The $0.000013 level is currently undergoing a retest as support, after being broken to the upside. This configuration is technically sound and increases the probability of a sustained bullish movement if this floor holds firm against current selling pressure.
The momentum indicators reinforce this optimistic scenario. The RSI displays a structure of higher highs and higher lows moving toward the neutrality line at 50, a typical signal of an ongoing trend reversal. Simultaneously, the MACD histogram is developing above its signal line, confirming a progressive accumulation of buying pressure beneath the surface of the market.
The critical breakout threshold is located in the major distribution zone from October around $0.000016. A daily close above this horizontal resistance would unleash a bullish potential of 120% toward the technical target of $0.000028, calculated according to the triangle’s height projected upward.
In a more optimistic scenario, if macro conditions improve further, particularly with Fed monetary easing in 2026, BONK could target the mid-year highs near $0.000042, representing a potential gain of 220% from current levels.
Key levels to watch for trading BONK
Professional traders are monitoring several decisive price zones for the coming days. To the downside, temporary consolidation could bring the price back toward the secondary support at $0.000011, which corresponds to the floor of the descending triangle. A bounce from this level would further strengthen the double bottom scenario, one of the most reliable reversal patterns in technical analysis.
This retest would not necessarily be negative. On the contrary, it would allow for the absorption of residual selling pressure and establish a more solid technical base before a decisive bullish impulse. The key lies in the volume reaction during this potential test: declining volume would validate seller exhaustion.
To the upside, the immediate resistance at $0.000016 constitutes the gateway to a parabolic acceleration phase. Technical traders typically place their protective stops just below $0.000012 and target a first conservative objective around $0.000020, the former November local high.
Risk management remains paramount for this type of volatile asset. Positions with a risk/reward ratio of at least 1:3 offer a prudent approach suited to the risky profile of memecoins.
Launch your bot on BONK like 100,000 professional traders and try to win 1,000 USDT!
Related articles:

