

A Classic Technical Correction Bitcoin in a Bull Market
Bitcoin ‘s drop below $100,000 fits within a perfectly normal dynamic for such a volatile asset. Profit-taking after a parabolic rise is commonplace in the crypto market. Investors who rode the rally over recent weeks naturally sought to secure their gains, creating temporary selling pressure.
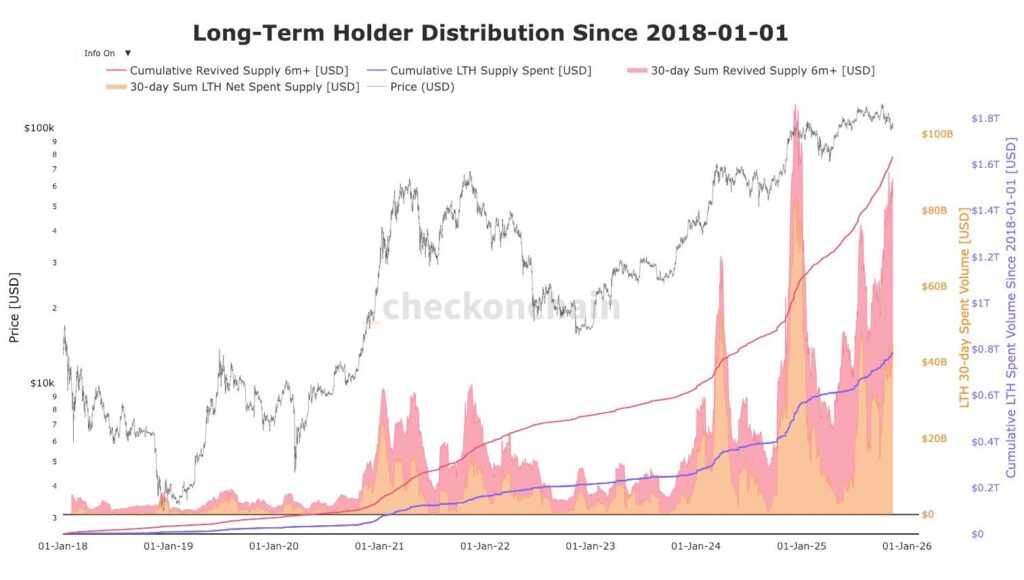
However, the charts reveal massive distribution from long-term holders. These are peaks never seen before.
Additionally, on-chain data reveals that this correction is also fueled by short-term holders. The MVRV ratio shows that Bitcoin is not in extreme overbought territory, contrary to previous market tops.
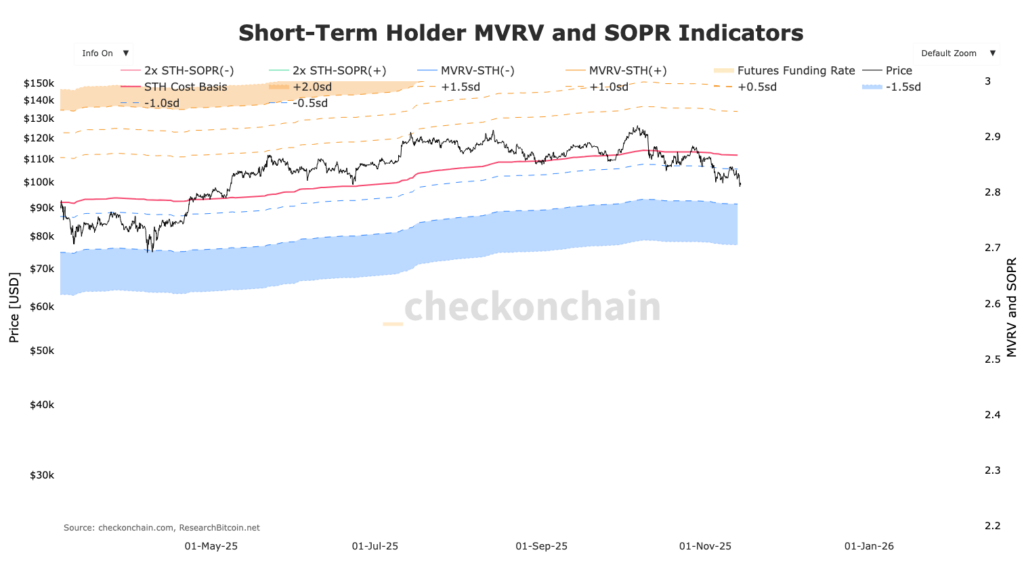
Nevertheless, the STH indicator shows that Bitcoin has broken essential support levels. A break of the dotted blue line has always pushed the price into the lower blue band. This is located between $91,000 and $79,000.
Technical analysis may nonetheless suggest a healthy consolidation phase as long as the $96,000 support holds. The RSI has returned to neutral territory after approaching oversold levels, creating an ideal context for a bounce. Bollinger Bands are tightening, a classic signal that often precedes significant price movements.
Mixed Institutional Adoption
Despite short-term volatility, institutional Bitcoin adoption experienced its worst capitulation day in history. Nevertheless, several major investment funds have increased their BTC exposure in recent weeks. Spot Bitcoin ETFs continue recording consistent net inflows, demonstrating solid institutional confidence in the asset’s long-term trajectory.
The macroeconomic context works against Bitcoin, as the stock market begins showing signs of weakness. Accommodative monetary policies from central banks and persistent inflation reinforce the attractiveness of assets decoupled from the traditional financial system. Investors seek hedges against currency devaluation, and Bitcoin’s underperformance relative to gold and silver yesterday shows that Bitcoin still takes a backseat for investors.
To accumulate Bitcoin like institutions, Pionex’s Grid DCA Bot is a 100% spot robot (no leverage, zero liquidation risk) designed to accumulate Bitcoin (BTC) intelligently, even during major market drops.
The bot automatically purchases a fixed amount (e.g., 100 USDT of BTC) at regular intervals (every 24h, 12h, or 7 days). This smooths the entry price over the long term. It allows optimization of returns up to 180% annualized profits.
Here’s how to launch it: Go to Pionex and click on Bots > Spot > Grid Trading > DCA Grid > BTC/USDT.
Technical Indicators Point to Potential Rebound
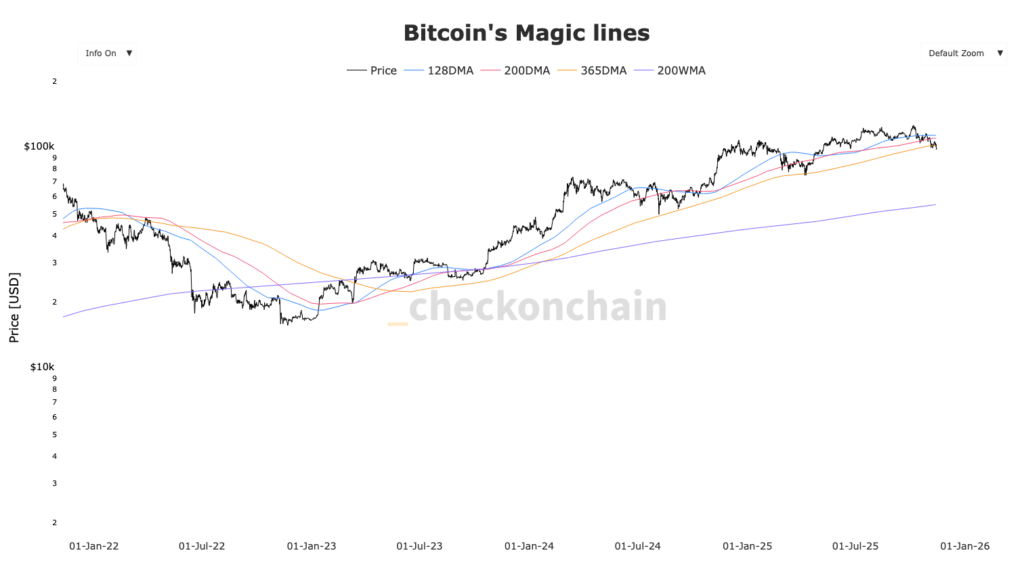
Even technical analysis doesn’t favor the bulls. Indeed, Bitcoin has lost its crucial moving average at $102,000 and its historical 365DMA moving average.
On the other hand, market sentiment data shows a Fear & Greed Index in moderate fear territory, historically a good entry point for contrarian investors. Perpetual contract funding has normalized after reaching excessive levels, eliminating the risk of liquidation cascades. This purge of excessive leverage creates healthier technical foundations for sustainable recovery. Indeed, the massive STH capitulation could serve as an opportunity for smart money to intervene. For now, buying volumes are not responding to the call, and this needs monitoring in the coming days.
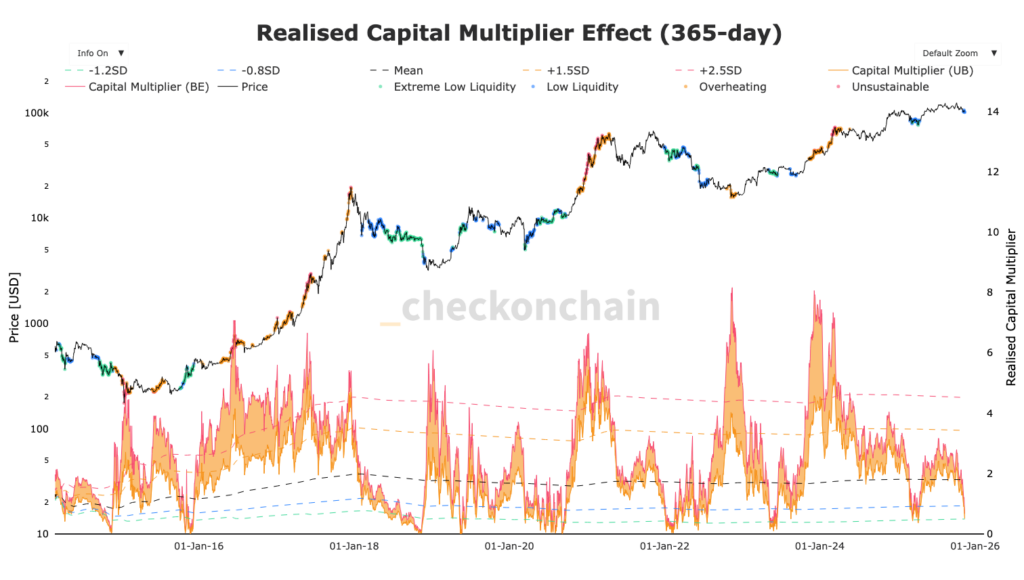
The Realized Capital Multiplier Effect indicates a major liquidity shortage. In these low zones of the chart, enormous capital and therefore liquidity inflows are needed to push the price back up.
Related Articles:

