

Chaikin Money Flow and OBV Diverge from Price
The Chaikin Money Flow (CMF) and the On-Balance Volume (OBV) are both showing notable improvement even as the price continues to plunge. The CMF, which measures buying/selling pressure by combining price and volume, had been in freefall since November 10 and had even turned negative during the brutal correction. But between November 16 and 19, it formed a higher high while the Cardano price marked a lower low.
This bullish divergence represents a strong technical signal. It shows that despite the apparent price weakness, incoming money flows are gaining intensity. In other words, buyers are quietly accumulating while the market is still selling. The OBV, which cumulates volume based on price direction, follows the same trajectory and confirms this gradual accumulation.
When these two indicators improve simultaneously near a major structural support, it often indicates that a short-term reversal is brewing. The market is absorbing supply without the price collapsing further, a classic sign of resilience before an attempted recovery. It remains to be seen whether this dynamic is reflected in the on-chain behavior of holders.
Cardano Holders Maintain Their Positions Despite the Drop
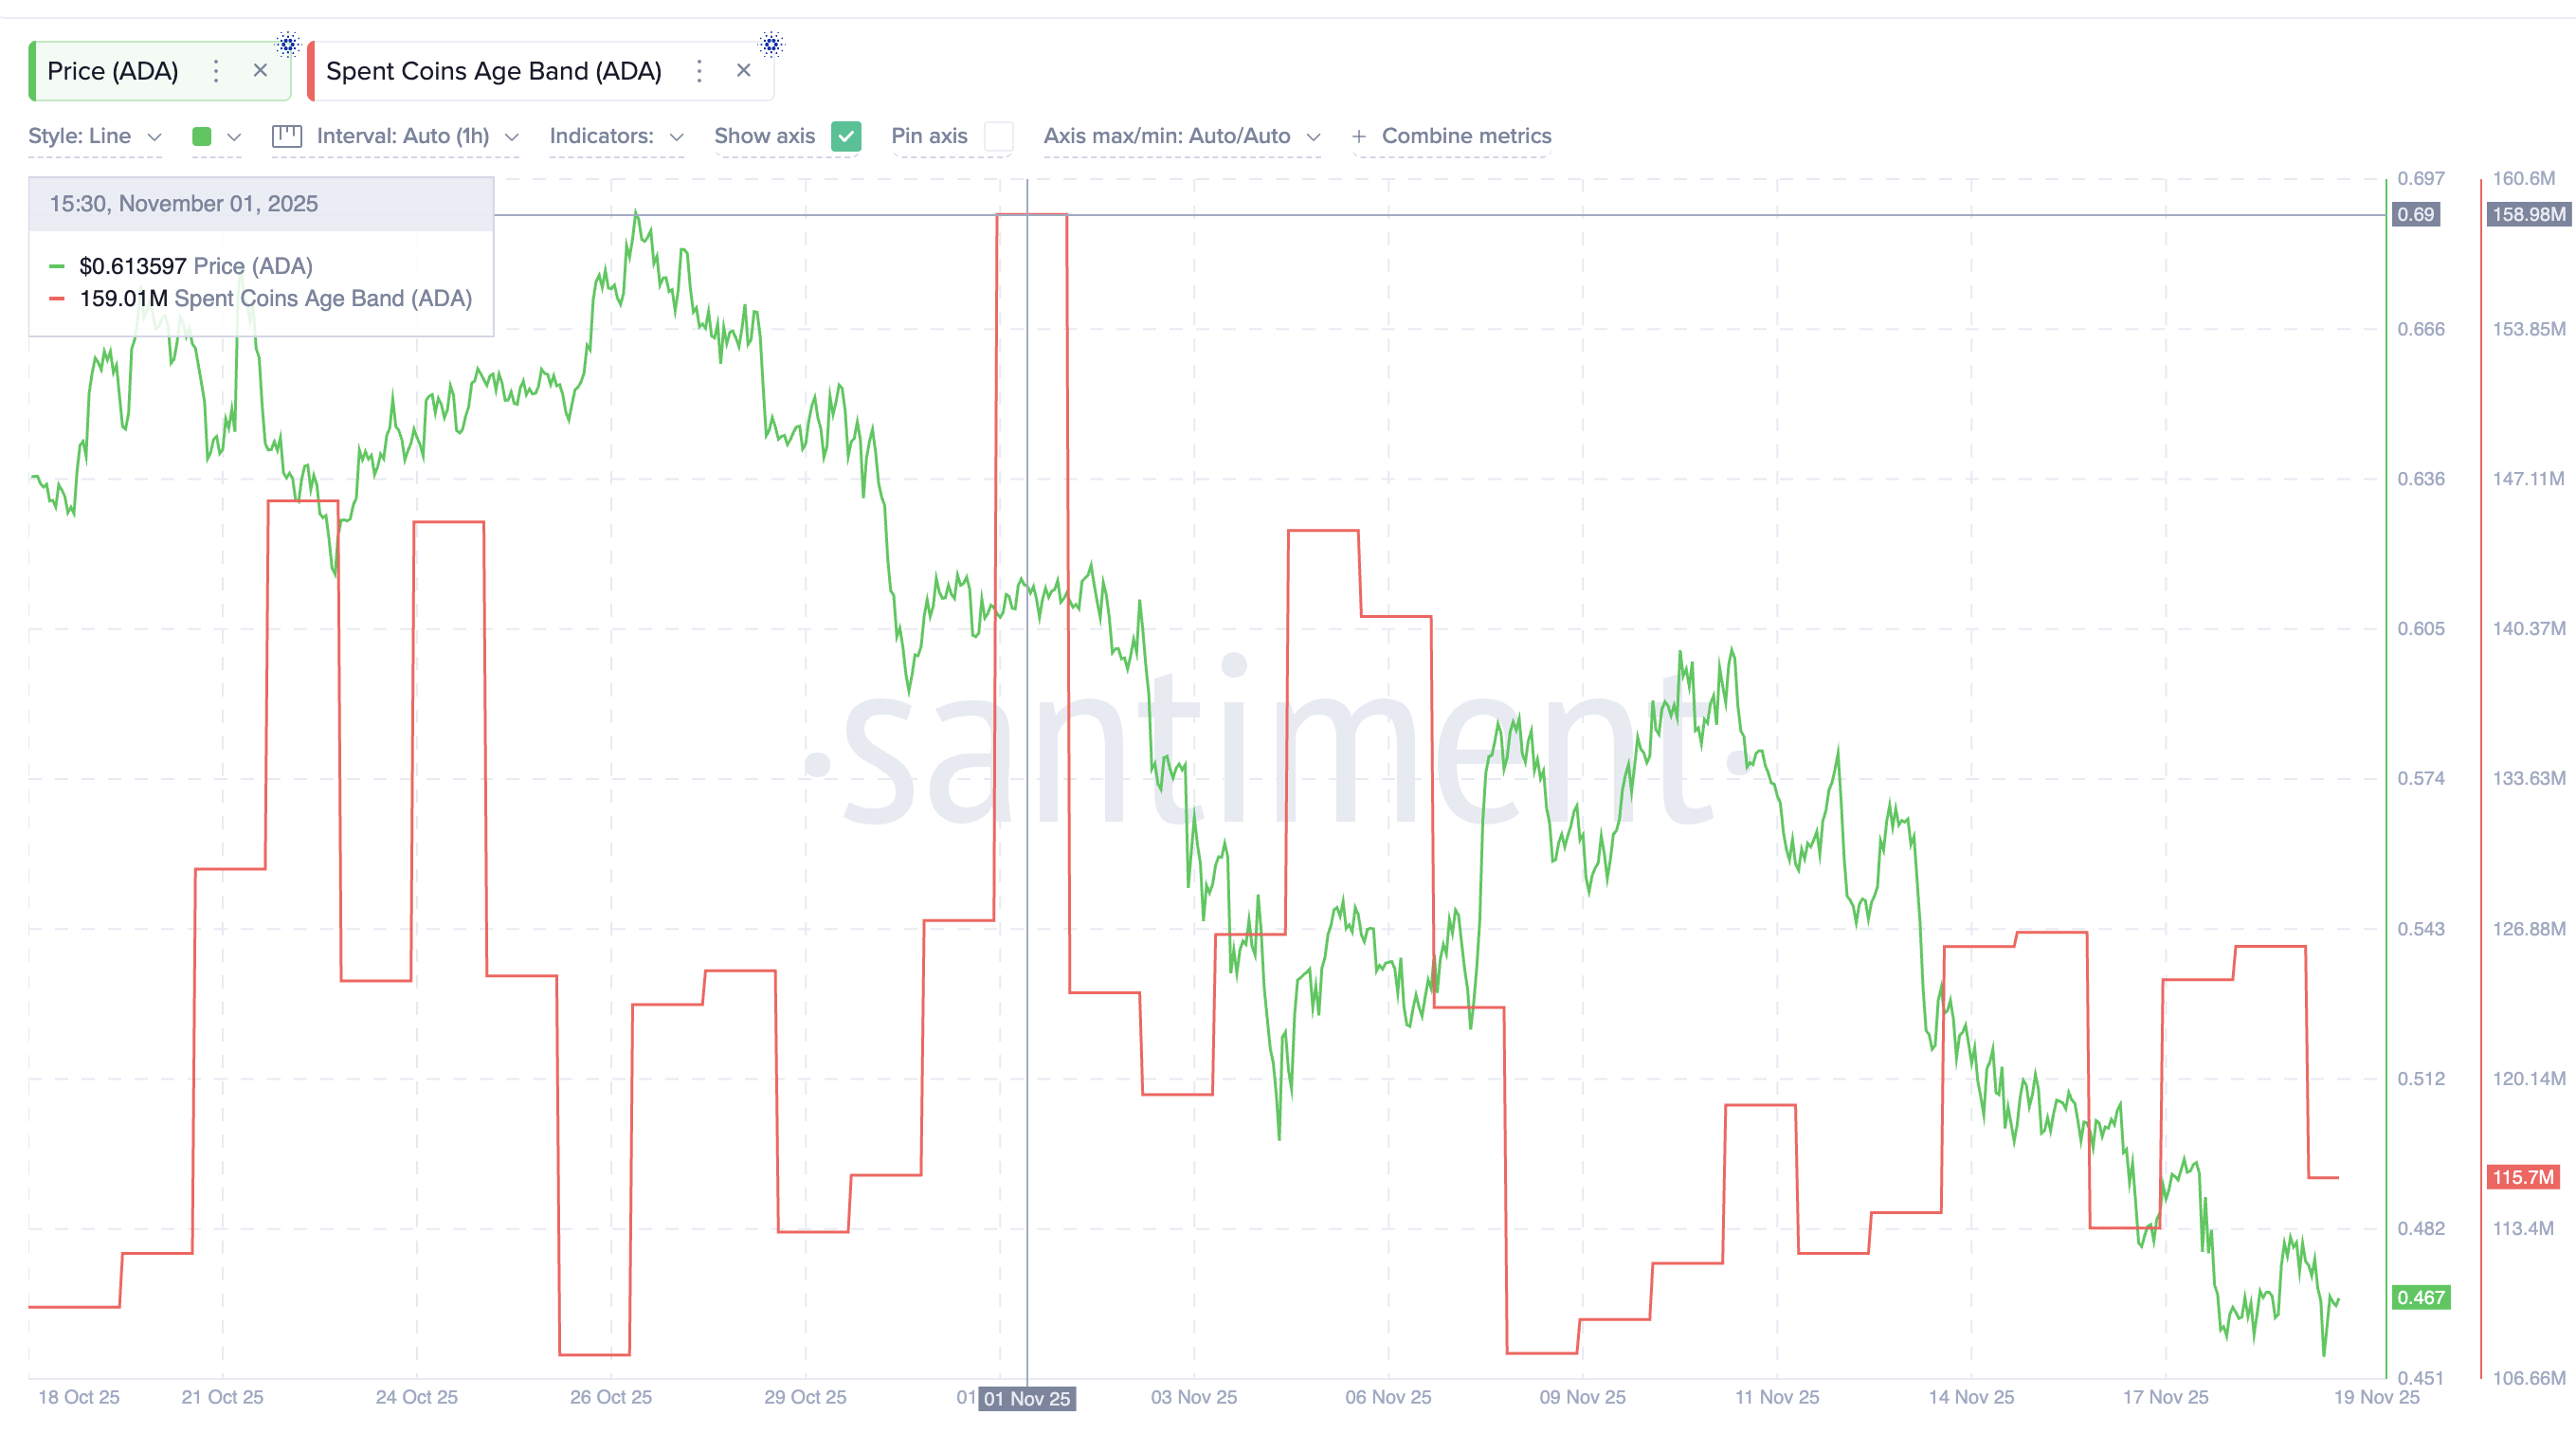
The Spent Age Band metric shows a notable decline in token movement during the correction, contrary to typical sell-offs where volumes explode under panic. This inertia indicates strong conviction among long-term holders, who refuse to sell despite the bearish pressure. Their restraint limits selling pressure and reinforces the idea of a defended support, creating fertile ground for a potential short squeeze if demand picks up again.
This on-chain dynamic aligns with the technical signals from CMF and OBV, both improving despite the price drop. This triple convergence of quiet accumulation, bullish volume indicators, and support defense constitutes the third pillar of the bullish scenario and attracts the attention of traders looking for a favorable entry point.
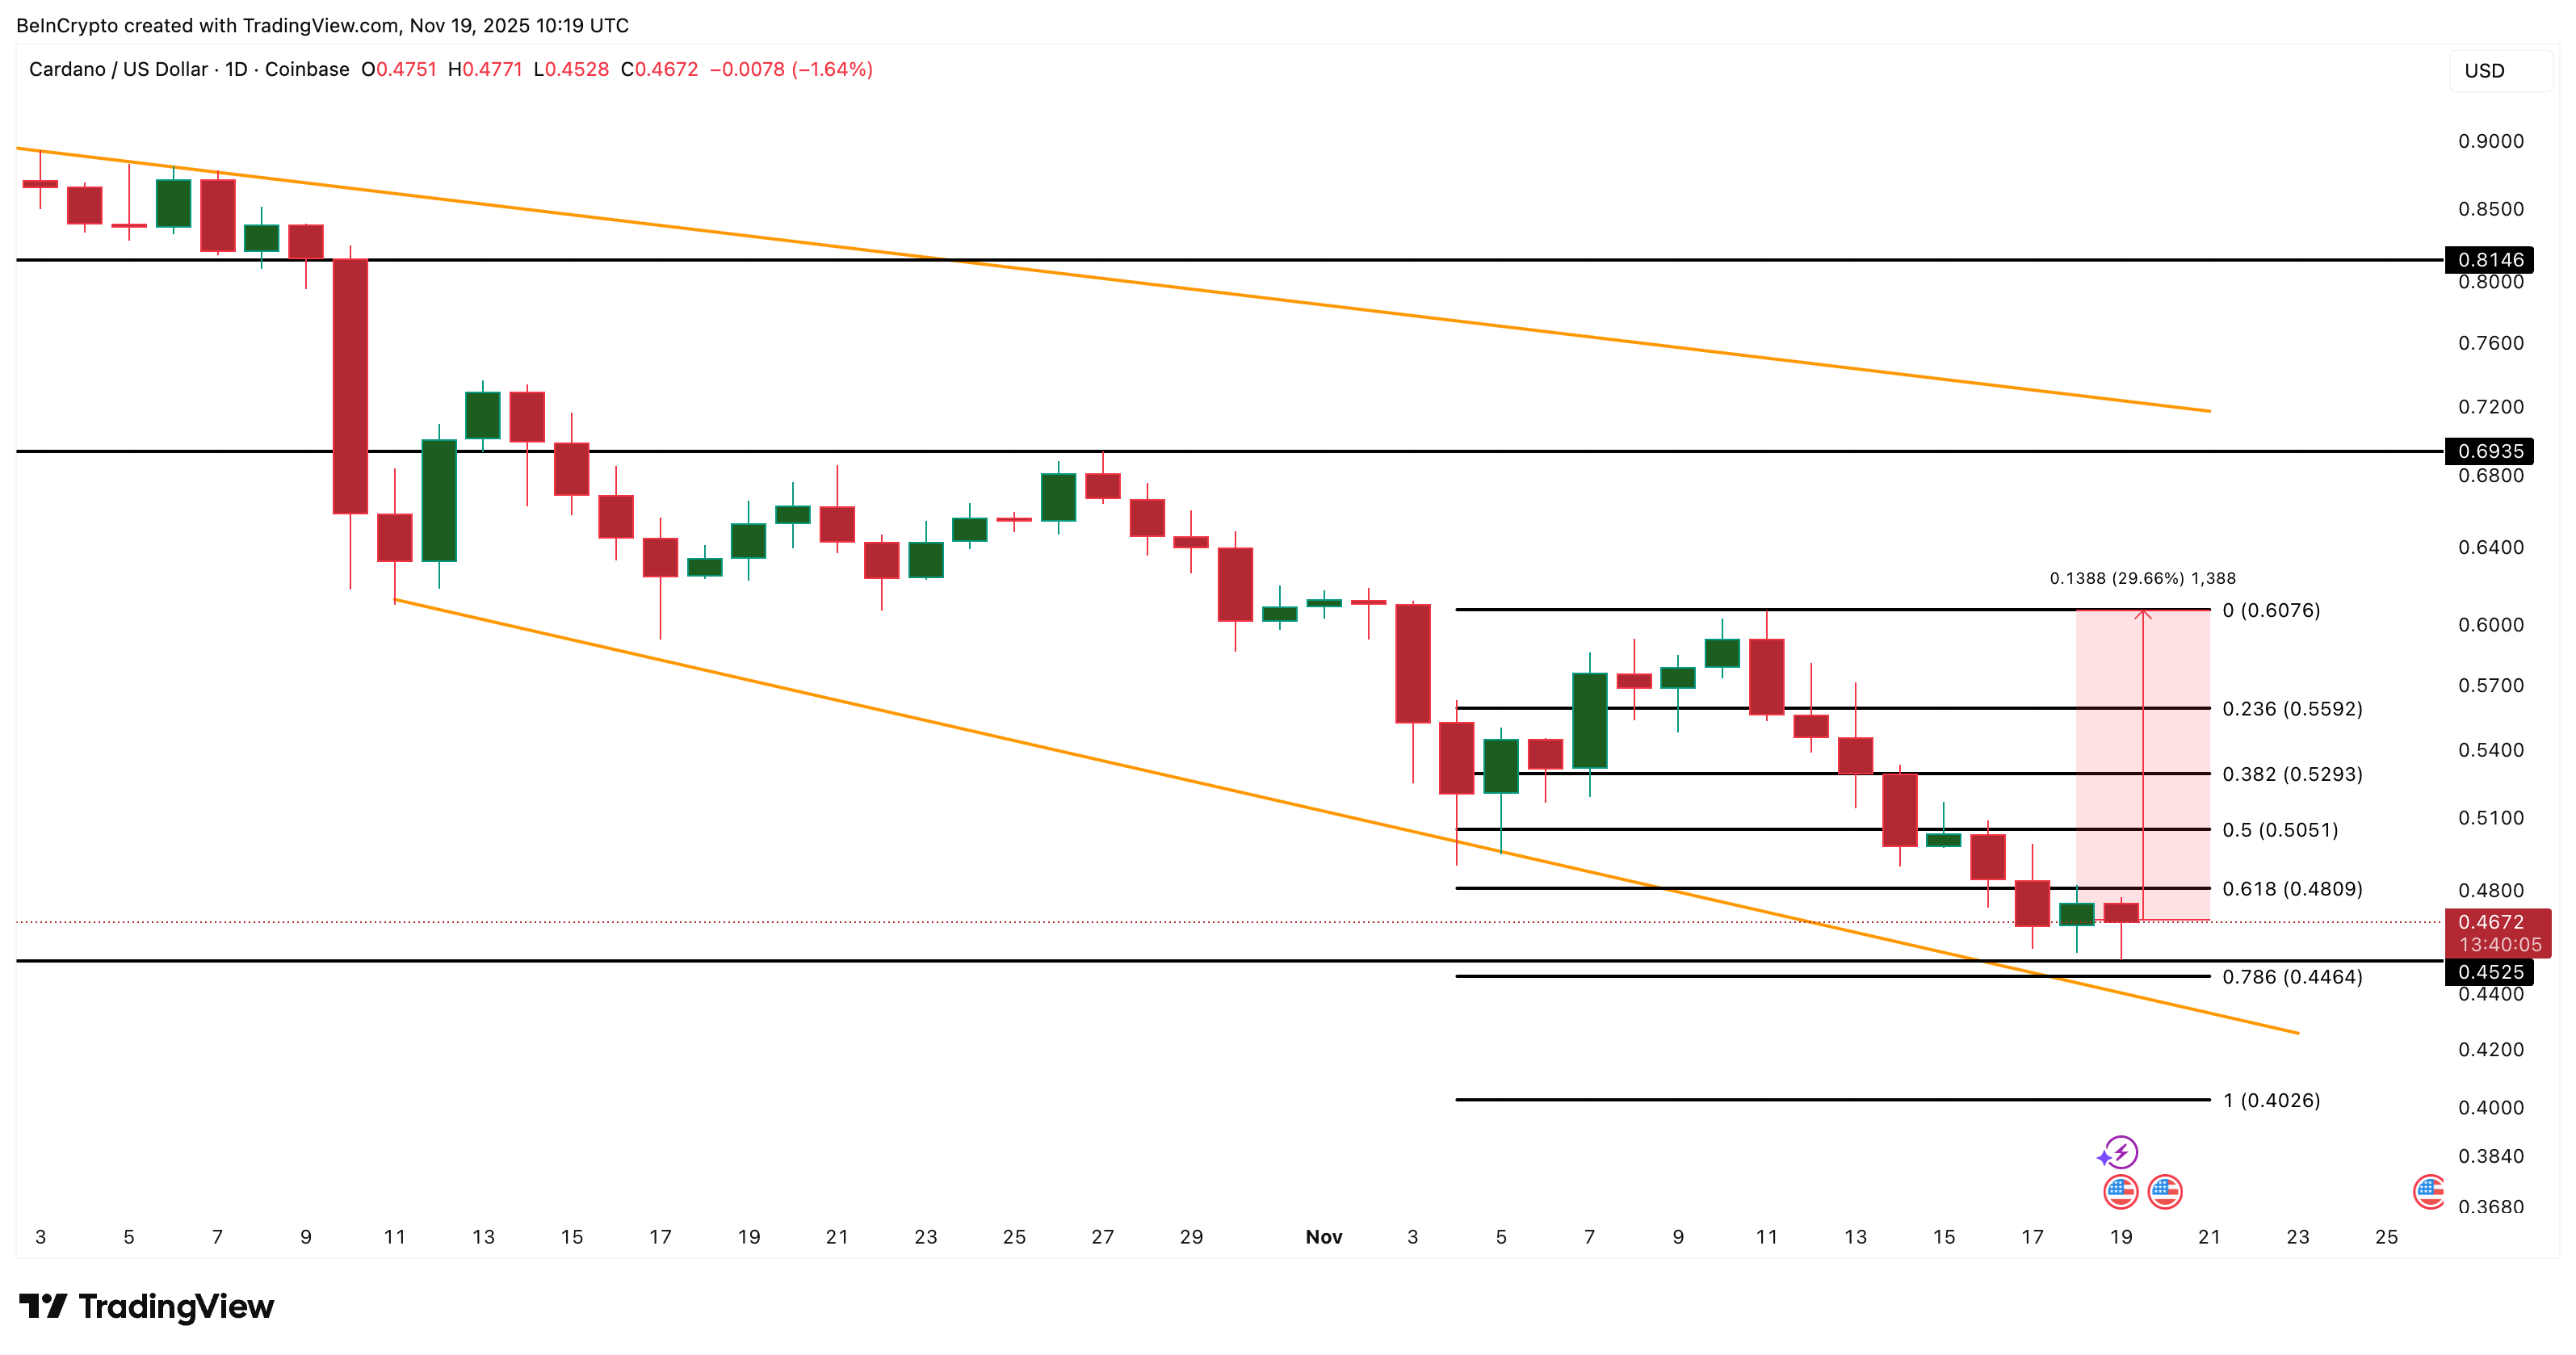
The $0.45–$0.44 level will be decisive for ADA. A daily close above would pave the way for a bounce toward $0.50–$0.52, with confirmation of reversal if $0.60 is breached. Beyond that, the target could reach $0.69, representing a potential gain of +35%. Conversely, a clear break below $0.44 would invalidate the bullish scenario and expose ADA to a drop toward $0.40 or lower if market sentiment deteriorates.
Related content:

