

US Traders Reverse the Bearish Trend
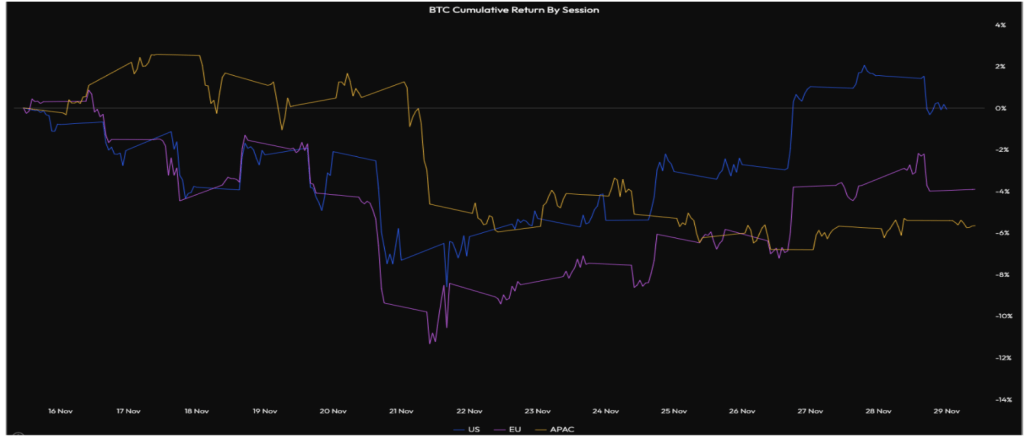
The figures on Velo’s chart are unequivocal: the blue line representing US trading hours rose from 2% to 7.55% between November 24 and 26, marking a progression of more than 5 percentage points in just two days. This acceleration of US demand represents a decisive turning point for the crypto market.
This reversal can be explained by several converging factors. US institutional traders appear to be taking advantage of current price levels to accumulate, likely anticipating a structural market recovery. US trading hours, which displayed a negative delta at the beginning of the week, now show sustained buying conviction.
The impact on Ethereum and XRP has been particularly striking. These assets, which had suffered intense selling pressure during previous weeks, are now benefiting from the momentum created by Bitcoin. US buying volume is acting as a catalyst, allowing these cryptocurrencies to reclaim important technical levels and stabilize their price ranges.
This US dynamic contrasts with the relative neutrality of Europe and persistent weakness in Asia. US trading sessions have thus become the primary driver of the spectacular recovery of Bitcoin, Ethereum, and XRP, establishing a new paradigm for the crypto market.
Unprecedented Ledger Black Friday Offer!
Secure your crypto on a Ledger right now by taking advantage of this exceptional limited-time Black Friday offer. 50% off and up to $90 in rewards!

Asia Remains the Weak Link in This Crypto Rally
While the United States injects liquidity into the market, Asia maintains constant selling pressure. The APAC session, represented by the yellow line on the Velo chart, oscillates between -5% and -7% throughout most of the week, confirming a pattern observed throughout 2024.
This structural weakness in Asian demand raises questions. Several hypotheses circulate among analysts: profit-taking after gains accumulated early in the year, capital reallocation toward other asset classes, or regulatory concerns in certain countries in the region. Whatever the reason, this geographic divergence creates heightened volatility during transitions between trading sessions.
Europe, meanwhile, displays more nuanced behavior. European trading hours rose to 3.31% before falling back slightly, suggesting moderate demand but without strong conviction. The purple line on the Velo chart indicates that Europe no longer constitutes a major source of selling pressure, unlike previous weeks, but neither does it provide significant support to the current rally.
This tripartite configuration creates a market where price movements heavily depend on trading hours. Savvy traders are now adapting their strategies according to these regional patterns, maximizing their positions during US hours and reducing their exposure during Asian sessions.
Related articles:

