

Is BNB on the Verge of Falling Lower?
BNB has just experienced a brutal reversal. After reaching a new all-time high of $1,370 in October, the native token of the BNB Chain took the full brunt of the latest sell-off wave that shook the entire crypto market. This bearish movement now raises a legitimate question among investors: is this simply a healthy technical correction or the beginning of a larger-scale downtrend?
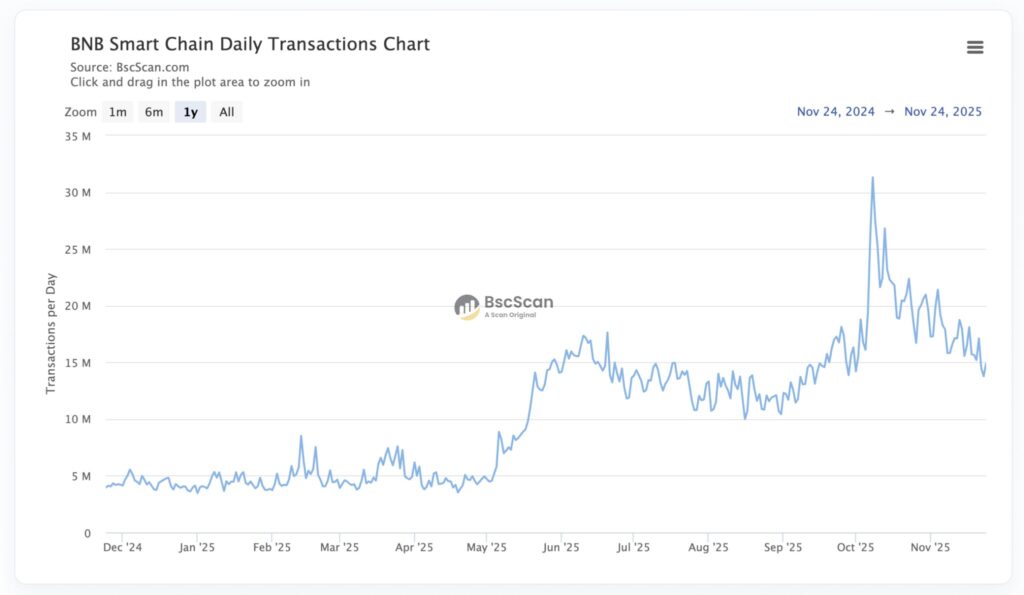
On-chain data provides concerning answers. According to BSC Scan, daily transactions on BNB Chain have plummeted dramatically since their peak of 31.3 million recorded on October 8th. This metric serves as a reliable indicator of actual user engagement and ecosystem vitality. Its decline suggests a structural weakening of the bullish momentum.
The situation has particularly deteriorated recently, with a 50% drop in daily transactions observed within just a few days. This brutal collapse is primarily explained by a cascade of forced liquidations that massively ejected leveraged traders from the market. Overexposed long positions were swept away during the correction, creating a domino effect that amplified the bearish movement.
Network Activity Collapses: A Major Bearish Signal for BNB
Analysis of network activity reveals a worrying paradox. Until recently, the BNB Chain ecosystem was experiencing sustained growth, driven notably by the emergence of innovative protocols. Aster, a perpetual futures trading platform, has established itself as a serious competitor to Hyperliquid in this strategic crypto market segment. This competition for perpetual DEX leadership had energized the entire ecosystem.
Meanwhile, PancakeSwap, the historic DEX of BNB Chain, recorded record trading volumes this year. This surge in activity demonstrated the growing appeal of blockchain-native decentralized solutions among traders. This thriving ecosystem partly justified BNB’s elevated valuation.
However, the current correction has brutally reversed this dynamic. As long as transaction volumes remain this poor, BNB will struggle to reclaim the psychological level of $1,000. More concerning still, the token risks experiencing additional bearish pressure if it fails to defend certain critical technical support levels. This correlation between network activity and price action is not insignificant: it reflects users’ real confidence in the ecosystem.
Get $90 in free BTC when you purchase your Ledger now. Take advantage of the limited Black Friday offer and protect your crypto with the best wallet on the market:

Technical Analysis: A 20% Downside Risk Looms in the Short Term
From a technical analysis perspective, BNB displays a concerning structure. The price movement has broken through a first bullish trendline to the downside, and a second one sits around $750. A drop below this price would trigger a wave of liquidations.
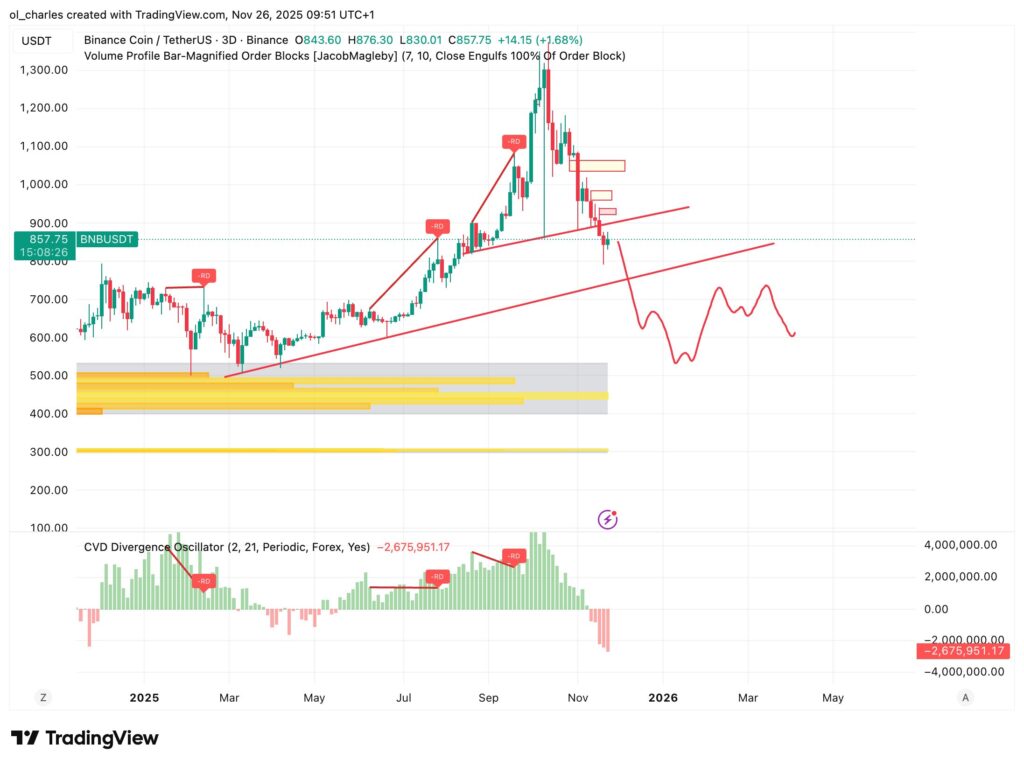
A return to the strong demand zone, designated by the orange Order Block, therefore has a high probability of being reached. This zone sits between $400 and $530, which would represent an additional drop of more than 30%.
The momentum remains dangerously weak. The Relative Strength Index (RSI) has collapsed near the 30 level, flirting with the oversold zone. This configuration reflects intense selling pressure and temporary demand exhaustion. Historically, these conditions can precede either a technical bounce or a final capitulation by the last remaining bulls.
The 200-day exponential moving average now constitutes major resistance, currently positioned at $883. This key technical level represents a significant obstacle to any bullish recovery attempt. Even in case of a breakout from the descending wedge, the long-term trend remains bearish. Technical traders are therefore closely monitoring price behavior around this EMA 200, which will serve as a barometer for upcoming events.
The bearish scenario gains momentum if BNB fails to reclaim the $900 zone in the coming sessions. In this hypothesis, a corrective move toward $750 would constitute the first technical target, followed by a potential extension down to $530.
Related articles:

