

An Inverted Head and Shoulders Pattern Forms on Ethereum Charts
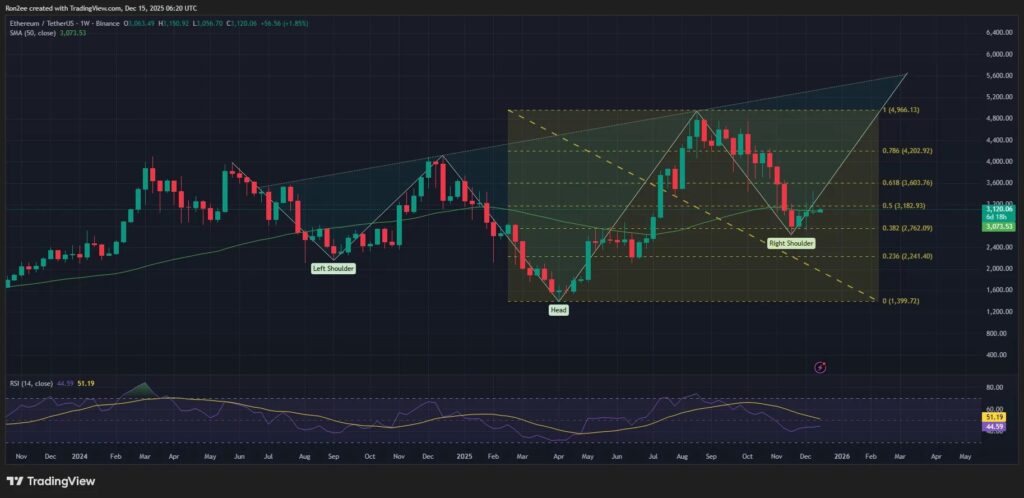
Technical analysis reveals the emergence of a particularly significant chart pattern for Ethereum. This inverted head and shoulders configuration represents one of the most reliable bullish reversal patterns in technical trading. According to data from crypto.news, ETH was recently trading around $3,113, a strategic level that could serve as a springboard for a new impulse.
The current structure shows a left shoulder formed during previous corrections, a head marking the deepest low point, and now a right shoulder under construction. The neckline, a critical resistance level, sits around the $3,400 to $3,500 zone according to observed timeframes. A breakout above this zone would confirm the pattern and activate a theoretical price target calculated by projecting the height of the figure from the breakout point.
Trading volumes are accompanying this formation encouragingly. We typically observe a gradual decrease in volume during the formation of the head and shoulders, followed by a substantial increase upon the breakout of the neckline. This volume dynamic validates the pattern’s strength and reinforces the probability of a sustained bullish movement rather than a simple false signal.
Spot Ethereum ETFs Become Attractive Again to Investors
After a week marked by net capital outflows, spot Ethereum ETFs are once again recording positive inflows. This reversal in institutional sentiment coincides perfectly with the technical formation observed on the charts, creating a convergence of bullish signals rarely this evident. Institutional investors appear to be anticipating a favorable price movement and are repositioning their allocations accordingly.
Flow data shows that several major ETFs have recorded significant inflows over recent sessions. This dynamic contrasts sharply with the previous period when withdrawals dominated, likely reflecting temporary profit-taking rather than structural disinterest. The return of inflows suggests that fund managers and qualified investors perceive the current level as an attractive entry opportunity ahead of a potential rally.
The impact of ETFs on Ethereum’s price action should not be underestimated. Unlike speculative flows on exchanges that can reverse quickly, investments via ETFs tend to reflect medium-term convictions. The resumption of inflows could therefore provide sustainable support to ETH’s price and fuel the momentum needed to break through the key resistances identified in technical analysis.
Outlook and Levels to Watch for ETH
If the inverted head and shoulders pattern confirms with a clean breakout of the neckline, the technical target of 15% would place Ethereum around $3,580 to $3,600. This level also corresponds to a previously tested horizontal resistance zone, which could create temporary friction before a potential continuation. Traders will need to monitor price behavior at this level to assess the real strength of the bullish trend.
Complementary technical indicators support the bullish scenario. The RSI shows positive divergence across multiple timeframes, suggesting that selling pressure is weakening despite relatively stable prices. Moving averages are beginning to converge in a favorable configuration, with the 50 MA potentially soon crossing above the 200 MA, generating a golden cross signal particularly watched by institutional investors.
Nevertheless, certain risks remain. A failure to break through the neckline would invalidate the pattern and could trigger a return to lower supports located between $2,900 and $3,000. The macroeconomic context, particularly monetary policy decisions and the evolution of general sentiment on risk markets, could also influence ETH’s trajectory independently of technical signals. Prudent traders will await clear confirmation with high volume before establishing significant positions.
Related content:

