

Dogecoin : Key Level Analysis
From a technical analysis perspective, Dogecoin is showing clear signs of weakness. Its price has slipped below its 7-day simple moving average of $0.233 and failed to maintain position above the Fibonacci retracement level of 23.6% at $0.2638. It’s now trading closer to the 38.2% retracement at $0.2496, struggling to regain momentum.
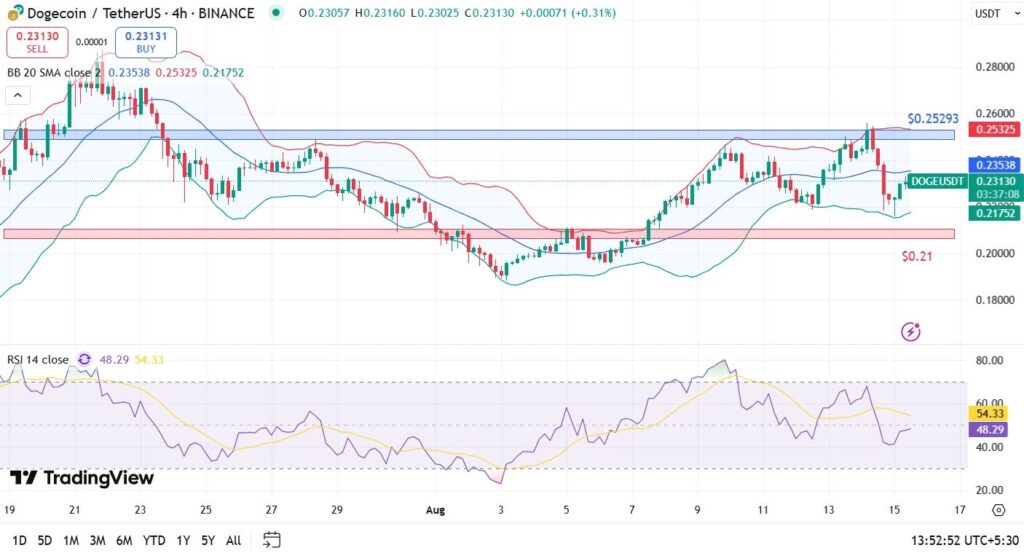
The RSI (Relative Strength Index) has fallen to 48.29, indicating a weakening bullish momentum. The breakdown of support at $0.23, which has now become resistance, significantly increases the risk of a further decline toward the critical support at $0.21, highlighted on the 4-hour chart.
What’s the Short-Term Outlook for DOGE ?
The Bollinger Bands are tightening, suggesting an imminent expansion in volatility. If buyers fail to defend current levels, Dogecoin could test the floor at $0.21. Conversely, a decisive break above $0.235 would be necessary to stabilize sentiment and reopen the path to a rebound toward $0.25 and beyond.
Some investors are looking to capitalize on DOGE’s decline by accumulating tokens. This presents an opportunity to build positions while anticipating future gains. If this aligns with your strategy, you can easily purchase DOGE through the Bitget application. Take advantage of a limited-time bonus offer !

