Dogecoin Set to Explode Like in 2017 : Is $1 the Next Target ?
Crypto analysts unanimously agree: Dogecoin (DOGE) appears to be following a bullish pattern similar to that of 2017, hinting at a potential new epic rally for the original meme coin. What does this mean for the future of DOGE?
Since the beginning of 2023, Dogecoin has experienced highs and lows, swinging between euphoria and disillusionment. However, some analysts suggest that DOGE’s current trajectory could mimic that seen during the famous bull run of 2017, hinting at a potential new peak of $1.1.
💡 WHEN DOGE?
The current pattern on the DOGE chart rhymes very well with the 2017 pattern. The bull market back then consisted of two roughly equal pumps, both in terms of value and duration. I’ve marked them on the chart on the left with two yellow, equal, and parallel lines… pic.twitter.com/Qra9wDan1o
According to the well-known crypto analyst Master Kenobi, the current Dogecoin price pattern is in line with the 2017 bullish frenzy. Back then, the memecoin experienced two roughly equivalent phases of increase in terms of duration and value. After an initial pump phase, DOGE then underwent a period of consolidation before recording a parabolic rally peaking at record levels.
“Based on the similarities between the 2017 bull run and the current cycle, Dogecoin could well experience the second phase of its bull run, just like in 2017,” stated Master Kenobi in a post on X. He predicts that DOGE could reach the long-awaited limit of $1 as early as the first week of June.
Technical Signals and Key Levels
Aside from the parallel with 2017, other crypto analysts also see positive technical signs for Dogecoin in the short term. Crypto trader Lycus, for example, believes that DOGE has bottomed out and a bullish reversal is imminent.
$DOGE is showing a bottoming formation after a sharp correction from $0.50, followed by a steep decline to the current support zone around $0.17.
This is a crucial level for $DOGE, as it has previously acted as a consolidation area before the last breakout. If DOGE rebounds from… pic.twitter.com/Irwed3ldw3
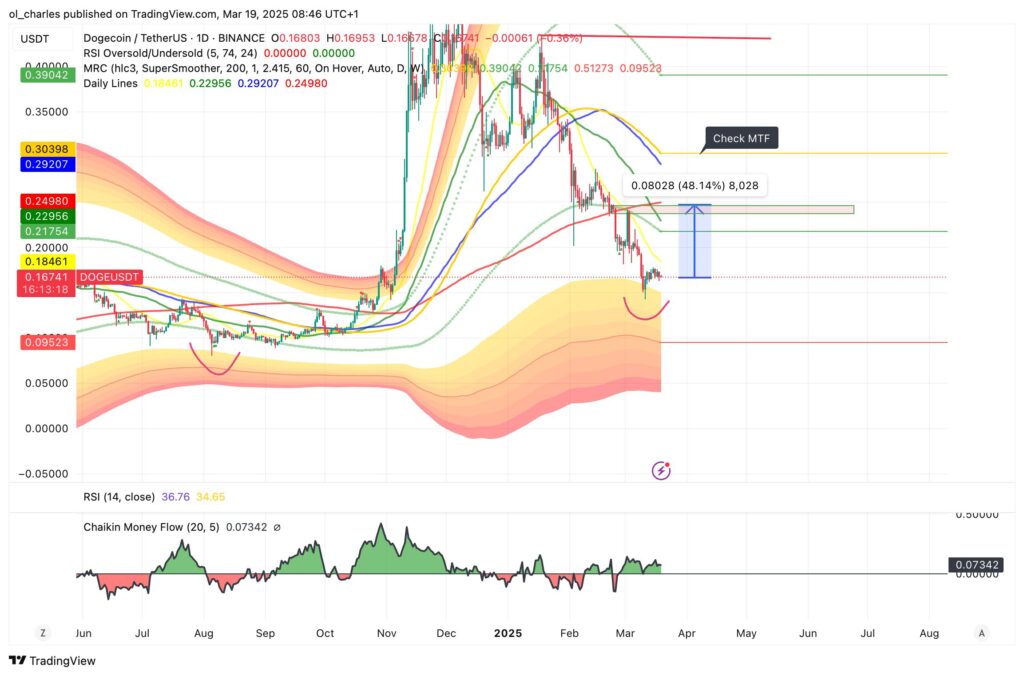
According to him, Dogecoin is showing a support formation after a sharp correction from $0.50, followed by a sharp decline to the current support zone around $0.17. This $0.17 level is crucial, having already served as a consolidation zone before the last breakthrough.
“If DOGE bounces from this zone, its price could rise towards $0.25 and $0.35“, indicated Crypto Lycus. However, he warns that a break below this support could lead to further decline towards $0.10.
On the other hand, analyst Trader Tardigrade has also noted that Dogecoin is currently building momentum to initiate a bullish trend reversal. His weekly chart indeed shows a doji, a signal often heralding a change in trend, as was the case at the start of the last rally.
Whether in June 2023 or August 2024, DOGE had rebounded from the lower end of its Mean Reversion Channel, before heading towards new highs. The chart shows that DOGE has touched this critical zone. So, can it repeat history?
DOGE will need to break the 24-cent resistance to stabilize in a new uptrend. A price that also corresponds to its 200-day moving average. This is the crucial resistance to watch.
Charles Ledoux is a Bitcoin and blockchain technology specialist. A graduate of the Crypto Academy, he has been a Bitcoin miner for over a year. He has written numerous masterclasses to educate newcomers to the industry and has authored over 2,000 articles on cryptocurrency. Now, he aims to share his passion for crypto through his articles for InvestX.
DISCLAIMER
This article is for informational purposes only and should not be considered as investment advice. Some of the partners featured on this site may not be regulated in your country. It is your responsibility to verify the compliance of these services with local regulations before using them.
DISCLAIMER
This article is for informational purposes only and should not be considered as investment advice. Trading cryptocurrencies involves risks, and it is important not to invest more than you can afford to lose.
InvestX is not responsible for the quality of the products or services presented on this page and cannot be held liable, directly or indirectly, for any damage or loss caused by the use of any product or service featured in this article. Investments in crypto assets are inherently risky; readers should conduct their own research before taking any action and invest only within their financial means. This article does not constitute investment advice.
Risk Warning : Trading financial instruments and/or cryptocurrencies carries a high level of risk, including the possibility of losing all or part of your investment. It may not be suitable for all investors. Cryptocurrency prices are highly volatile and can be influenced by external factors such as financial, regulatory, or political events. Margin trading increases financial risks.
CFDs (Contracts for Difference) are complex instruments with a high risk of rapid capital loss due to leverage. Between 74% and 89% of retail investor accounts lose money when trading CFDs. You should assess whether you understand how CFDs work and whether you can afford to take the high risk of losing your money.
Before engaging in financial or cryptocurrency trading, you must be fully informed about the associated risks and fees, carefully evaluate your investment objectives, level of experience, and risk tolerance, and seek professional advice if needed. InvestX.fr and the InvestX application may provide general market commentary, which does not constitute investment advice and should not be interpreted as such. Please consult an independent financial advisor for any investment-related questions. InvestX.fr disclaims any liability for errors, misinvestments, inaccuracies, or omissions and does not guarantee the accuracy or completeness of the information, texts, graphics, links, or other materials provided.
Some of the partners featured on this site may not be regulated in your country. It is your responsibility to verify the compliance of these services with local regulations before using them.
Get 6200 USDT with Bitget ! 🔥
Don't miss out on this offer !
Create your account now to unlock this exclusive reward