

Recurring Pattern Raises Concerns
On the daily chart, Dogwifhat (WIF) remains trapped in a symmetrical triangle, but short-term signals appear mixed. A notable fractal pattern, reminiscent of mid-June price action, is repeating in this consolidation phase.
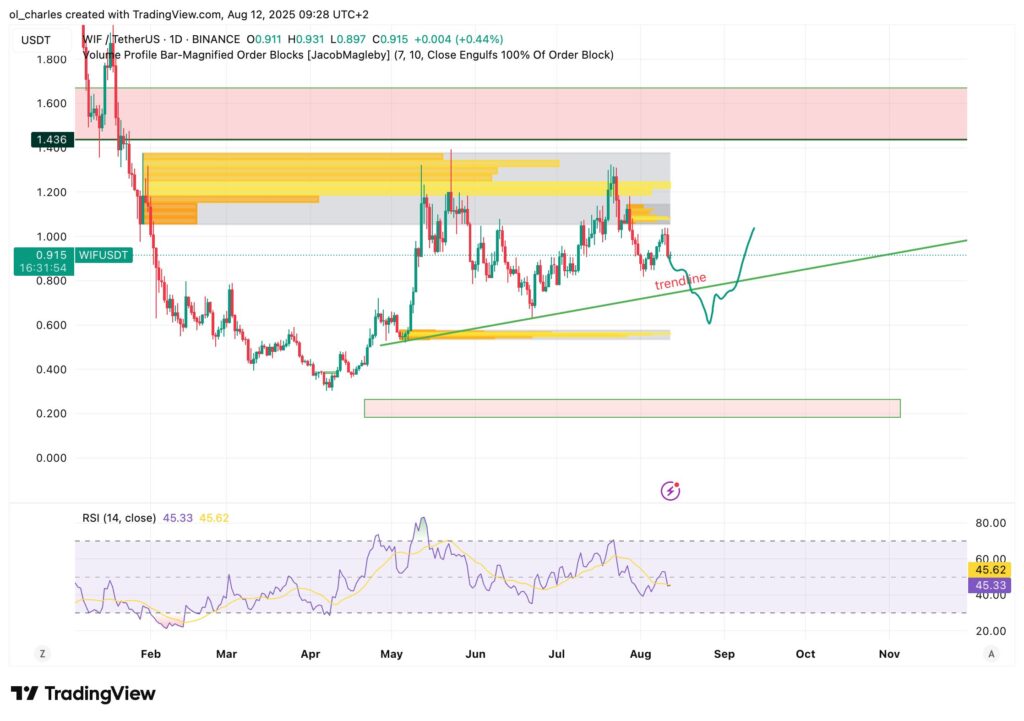
Last June, WIF fell below its 25-day moving average. The failed recovery attempt above this level subsequently triggered a 36% decline, bringing the price back to the support at $0.64.
Today, a new breach of the 25-day moving average ($1.01) has been observed, raising fears of a potential repeat of this bearish scenario.
Short and Medium-Term Outlook for WIF
If WIF fails to sustainably rise above its 25-day moving average, the pattern suggests a possible slide toward the lower boundary of the triangle, coinciding with the 200-day moving average support at $0.76. This would represent a decline of approximately 17% from current levels.
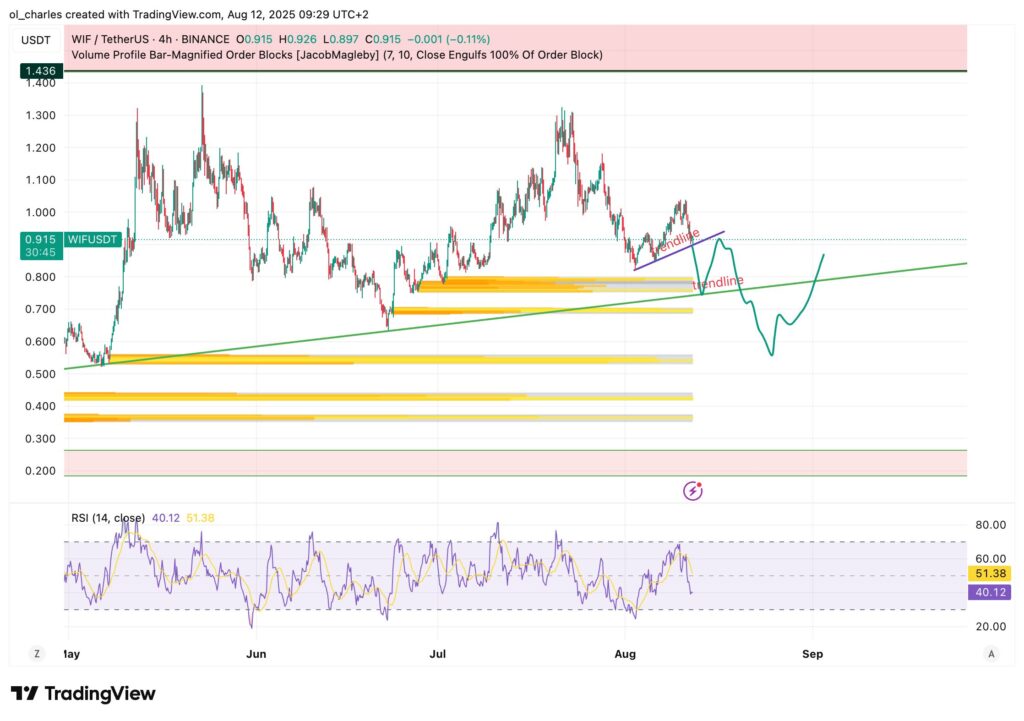
This level also coincides with a massive bullish trendline and an important liquidity zone from VP Order Blocks. However, this bullish trendline has a high probability of being liquidated, which could drive WIF toward the next liquidity zone at approximately $0.59.
However, a decisive breakthrough and close above the 25-day moving average could reverse the bearish trend and spark renewed buyer interest, paving the way for a bullish breakout of the symmetrical triangle. A return to $1.4 would then be possible.
Nevertheless, the chart indicates that WIF has been rejected twice from this zone between $1 and $1.4. A continuation of the bearish correction is therefore more likely as long as buyers remain on the sidelines.
Currently, $1.18 represents the protected upper level of smart money and absolutely must be broken to resume an upward momentum.
Dogwifhat’s (WIF) recent price action highlights a familiar technical pattern that raises short-term concerns. Although the memecoin has displayed bullish momentum for several weeks, investors would be wise to closely monitor the price behavior relative to the 25-day moving average.
A decisive breakthrough of $1.18 could revive upside potential, while another failure would pave the way for a significant correction.
As always, conduct your own analysis and exercise caution in your investment decisions.
How to Buy WIF on Bitget ?
To attempt buying the WIF dip at support levels like smart money does, here’s a guide to obtaining it on Bitget along with the strategy to adopt :
- Sign up on Bitget : Create an account on Bitget with an email address or phone number, then complete KYC verification.
- Deposit funds : Fund your account with fiat (bank card, wire transfer) or cryptocurrencies like USDT or BTC.
- Access the WIF market : In the “Spot Trading” section, select the WIF/USDT or WIF/BTC pair.
- Place an order : Choose a market order for immediate purchase or a limit order to set your price. Confirm the amount.
How to Position Yourself on WIF
To capitalize on this dynamic, here’s an optimized strategy :
- Progressive entries : Buy the dips between $0.82-0.76, waiting for stabilization or a daily RSI in oversold territory (<30) to accumulate using DCA.
- Key supports : Monitor $0.82 and $0.76 as buying zones. A drop below $0.76 would invalidate the bullish scenario. In that case, exit and buy at the next zone between $0.65 and $0.55.
- Take profits : Target $1.01 and $1.14 for partial gains, with an objective at $1.90 if the breakout is confirmed. Subsequently, between $4 and $10 are the most optimistic scenarios.
- Confirmation volumes : A volume spike above $1.01 will validate the bullish reversal.
- Risks : A correction below $0.76 could target $0.57. Manage positions with a tight stop-loss.

