Is Ethereum About to Skyrocket? Key Technical Levels for Trading Like a Pro
Ethereum stabilizes at $4,299 with a neutral RSI at 51.22, indicating healthy consolidation before a potential bullish breakout. Institutional investors maintain confidence with a long/short ratio of 3.7:1. Explore accumulation zones and strategies to benefit from the upcoming momentum.
Ethereum is displaying solid performance at $4,286 (+1.56% in 24h) with a neutral RSI6 at 51.22, suggesting a perfect balance between buyers and sellers, creating ideal conditions for strategic accumulation.
This technical situation comes with encouraging indicators: an institutional long/short ratio of 3.7:1 demonstrating persistent confidence, favorable short-term moving averages, and substantial volume of $936 million confirming sustained interest.
With solid support at $4,070 and critical resistance at $4,355, Ethereum is positioned in an attractive accumulation zone for investors looking to benefit from the next bullish impulse toward $4,450-$4,650.
Technical Analysis and Key Levels for Ethereum
The RSI6 at 51.22 places Ethereum in a zone of perfect neutrality, an ideal situation that avoids the extremes of oversold or overbought. This technical configuration offers significant room for progression in both directions but statistically favors an upward movement given the general context.
This short-term RSI neutrality is accompanied by a RSI12 at 57.21 that’s slightly bullish and an RSI24 at 61.20 approaching the overbought zone. This gradual progression of RSI indicators suggests progressive accumulation underway, without speculative excess.
The MACD presents a mixed signal with a DIF at 182.76 and a DEA at 219.53, indicating a weakened bearish momentum that could soon transform into a bullish signal. This technical configuration often prepares major trend reversals.
Unlike Bitcoin, which displays an extremely oversold RSI, Ethereum benefits from a more balanced technical situation that allows it to envision autonomous progression, independent of the movements of the reference cryptocurrency.
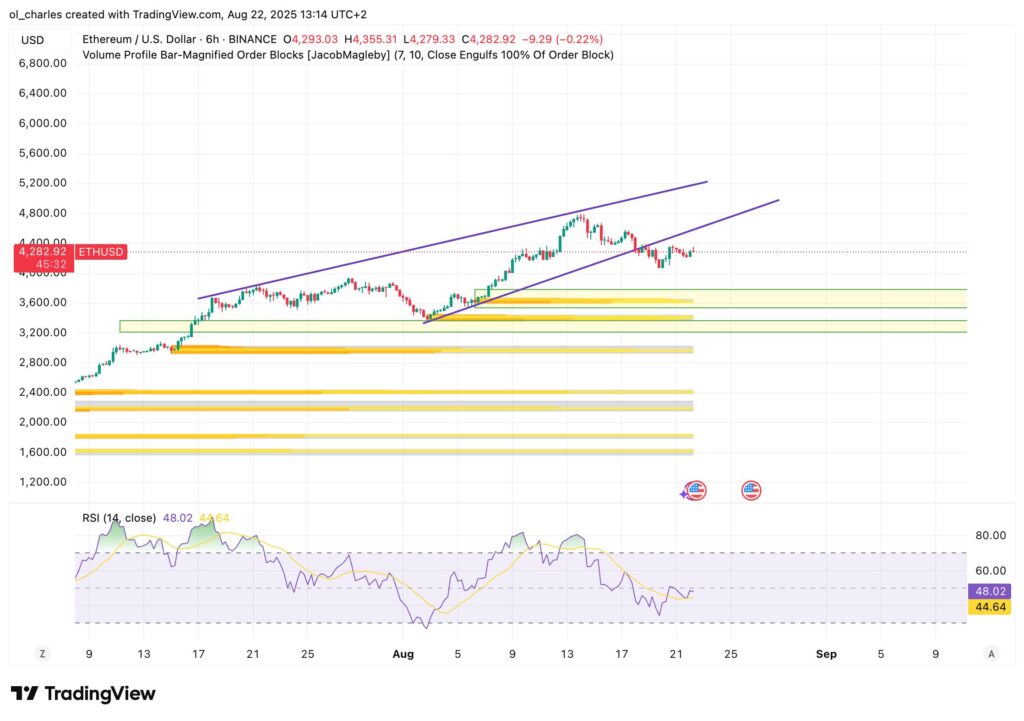
Nevertheless, ETH has broken below its pennant and could reach oversold territory with its 6H RSI in the coming days. A return to approximately $3,750 would be an opportunity to accumulate in case of a prolonged correction. Conversely, a sustained breakout above $4,530 would signal a rebound.
Favorable Technical Configuration: Solid Supports and Clear Resistances
Ethereum is currently evolving slightly above its short-term moving averages, with the EMA5 at $4,296.85 USDT and the EMA10 at $4,297.72 USDT. This configuration suggests moderate bullish momentum that could accelerate in case of a resistance breakout.
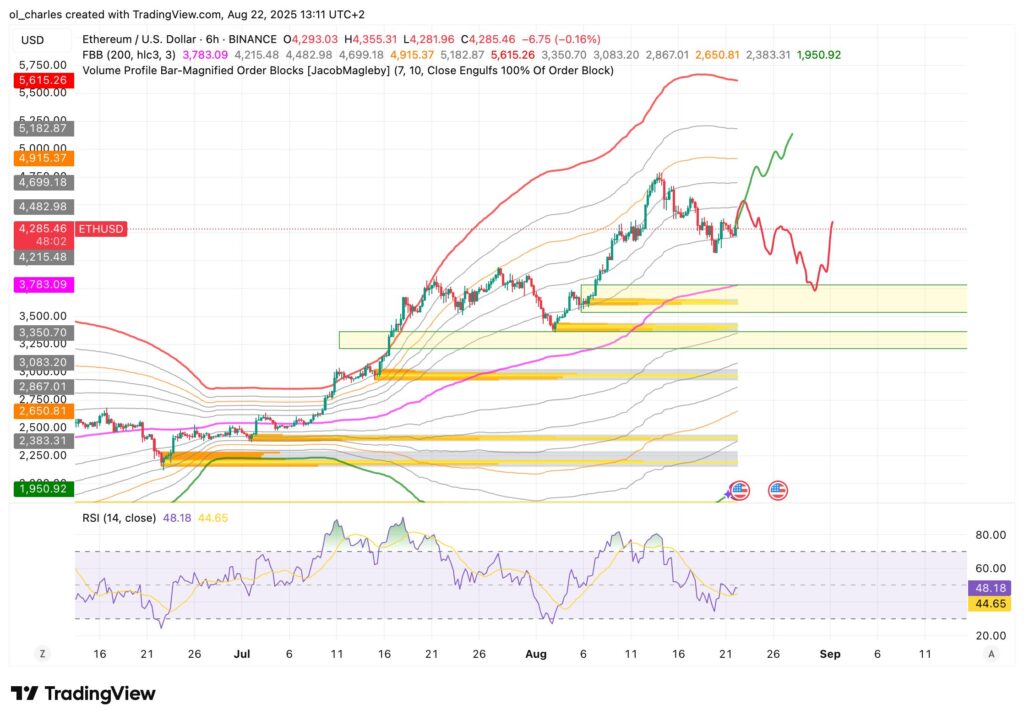
The Bollinger Bands analysis reveals an interesting situation with the current price close to the middle line at $4,169.46 USDT, offering potential for expansion toward the upper band at $4,884.87 USDT. This technical configuration favors marked directional movements.
The Fibonacci retracement levels identify key zones: critical resistance at $4,900 and $4,450.94 (23.6%), intermediate support at $4,071.93 (50%), and major support at $3,661.33 (78.6%). These levels constitute precise technical references for position management.
The immediate resistance at $4,355.42 represents the key level to watch. A breakout with volume would open the path toward the Fibonacci target of $4,450, $4,900, and potentially toward the upper Bollinger Band at $5,590.
The General Sentiment Remains Bullish
The long/short ratio of 3.7:1 (34,807 longs vs 9,385 shorts) demonstrates solid institutional confidence in Ethereum. This asymmetry, although less extreme than Bitcoin’s, indicates that professional investors consider current levels attractive.
Open interest reaches 1,139,537 ETH for a value of $4.81 billion USDT, a high level confirming institutional investors’ commitment. This significant exposure suggests bullish expectations in the medium term.
The slightly positive funding rate at 0.0026% remains moderate and avoids the speculative excesses observed during euphoria phases. This healthy situation favors sustainable progression rather than a speculative bubble.
The daily volume of $936 million USDT significantly exceeds that of Bitcoin ($603 million), demonstrating particularly sustained interest in Ethereum. This abundant liquidity facilitates price movements and reduces the risks of manipulation.
Optimal Strategy for Ethereum Accumulation
The current technical configuration presents a particularly attractive strategic accumulation opportunity. The neutral RSI, combined with solid technical supports and favorable institutional sentiment, creates ideal conditions for gradual positioning.
Primary accumulation zone: $4,200 – $4,300 USDT represents the optimal range to begin accumulation. This zone offers an excellent risk/reward ratio with the current price close to these levels and confirmed technical supports.
Secondary accumulation zone: In case of a retracement, the $4,070 – $4,150 USDT zone (50% Fibonacci retracement) would offer an even more attractive accumulation opportunity, although less likely given the current momentum.
Tiered price targets: Short-term at $4,450 USDT (+3.4%), medium-term at $4,650 USDT (+8%), and long-term at $4,885 USDT (+13.5%) constitute realistic targets. These levels correspond to technical resistances and Fibonacci extensions.
Recommended DCA approach: A progressive accumulation strategy over 2-3 weeks allows for smoothing the entry price and taking advantage of potential temporary corrections. The recommended allocation of 10-15% of the total portfolio maintains appropriate diversification.
Risk management: A stop-loss at $3,950 USDT (-8.2%) protects against a break of major support. This approach allows for limiting losses while maintaining enough room for normal market fluctuations.
This analysis reveals that Ethereum is going through a healthy technical consolidation phase that often prepares significant bullish movements. Investors who patiently accumulate in this zone could benefit from the next upward cycle when the resistance breakout is confirmed.
Charles Ledoux is a Bitcoin and blockchain technology specialist. A graduate of the Crypto Academy, he has been a Bitcoin miner for over a year. He has written numerous masterclasses to educate newcomers to the industry and has authored over 2,000 articles on cryptocurrency. Now, he aims to share his passion for crypto through his articles for InvestX.
DISCLAIMER
This article is for informational purposes only and should not be considered as investment advice. Some of the partners featured on this site may not be regulated in your country. It is your responsibility to verify the compliance of these services with local regulations before using them.
DISCLAIMER
This article is for informational purposes only and should not be considered as investment advice. Trading cryptocurrencies involves risks, and it is important not to invest more than you can afford to lose.
InvestX is not responsible for the quality of the products or services presented on this page and cannot be held liable, directly or indirectly, for any damage or loss caused by the use of any product or service featured in this article. Investments in crypto assets are inherently risky; readers should conduct their own research before taking any action and invest only within their financial means. This article does not constitute investment advice.
Risk Warning : Trading financial instruments and/or cryptocurrencies carries a high level of risk, including the possibility of losing all or part of your investment. It may not be suitable for all investors. Cryptocurrency prices are highly volatile and can be influenced by external factors such as financial, regulatory, or political events. Margin trading increases financial risks.
CFDs (Contracts for Difference) are complex instruments with a high risk of rapid capital loss due to leverage. Between 74% and 89% of retail investor accounts lose money when trading CFDs. You should assess whether you understand how CFDs work and whether you can afford to take the high risk of losing your money.
Before engaging in financial or cryptocurrency trading, you must be fully informed about the associated risks and fees, carefully evaluate your investment objectives, level of experience, and risk tolerance, and seek professional advice if needed. InvestX.fr and the InvestX application may provide general market commentary, which does not constitute investment advice and should not be interpreted as such. Please consult an independent financial advisor for any investment-related questions. InvestX.fr disclaims any liability for errors, misinvestments, inaccuracies, or omissions and does not guarantee the accuracy or completeness of the information, texts, graphics, links, or other materials provided.
Some of the partners featured on this site may not be regulated in your country. It is your responsibility to verify the compliance of these services with local regulations before using them.
Get 6200 USDT with Bitget ! 🔥
Don't miss out on this offer !
Create your account now to unlock this exclusive reward