

Is Ethereum key support level at risk?
Ethereum is navigating one of its most challenging technical periods since the start of 2026. Trading around $2,058 with a 1.3% decline over the past 24 hours, ETH is facing selling pressure that intensifies with every recovery attempt. The macroeconomic environment remains the primary headwind. Persistent geopolitical tensions in the Middle East, high bond yields in the US, and uncertainties surrounding the Fed trajectory are fueling a risk aversion sentiment that primarily impacts cryptocurrencies.
Spot Ethereum ETFs have recorded approximately $158 million in net outflows over the past week, reflecting weakened institutional demand. The selling pressure is not solely stemming from the spot market, as derivatives markets are amplifying the bearish momentum. The Taker Buy/Sell ratio on futures has fallen below the 1.00 threshold, marking its lowest level since November 2025. This metric is structurally significant. It indicates that aggressive sellers have been dominating the futures order book for several weeks, proving this is not just a temporary reaction.
The technical structure is deteriorating rapidly
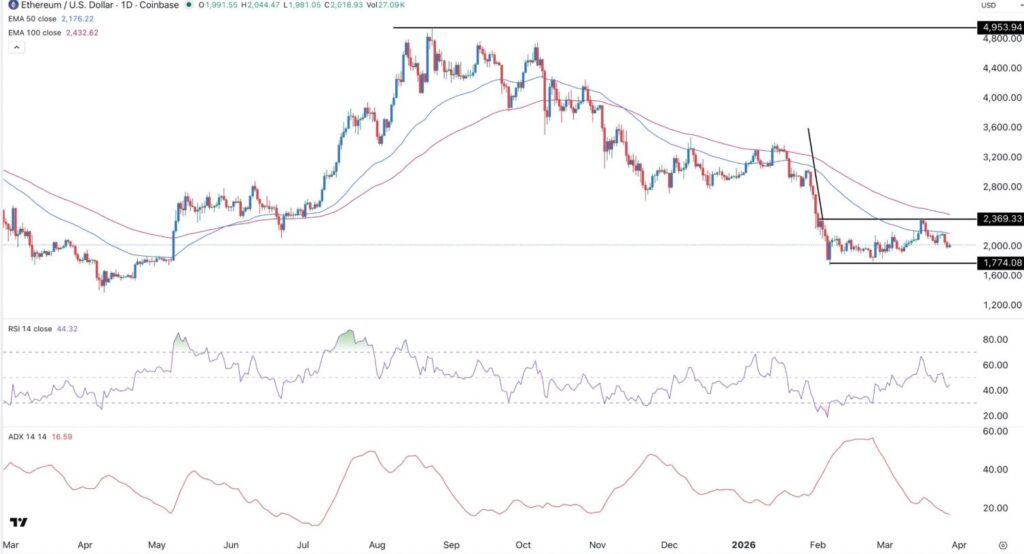
From a technical perspective, the situation for ETH is precarious. Ethereum is forming a bearish pennant pattern characterized by lower highs and lower lows. It is currently trading below the 0.786 Fibonacci retracement level located at $2,149. Momentum indicators are weak, featuring a MACD histogram at -19.12 and an RSI(7) at 32.61. These metrics signal oversold conditions but show no signs of a bullish reversal.
Data regarding ETH futures open interest reveals a sharp decline since the first week of February. The ADX (Average Directional Index) has dropped to 16, its lowest level in several months, pointing to a weakened directional trend. Spot Ethereum ETFs have shed assets for eight consecutive days, marking the longest streak of the year with weekly outflows exceeding $206 million.
All these metrics point to a single conclusion the conviction of institutional buyers is eroding. Every breakout attempt above $2,150 hits a wall of sellers who have been consistently defending this level since early March.
Crucial price levels to monitor closely
The support and resistance mapping is crystal clear. The $2,100 to $2,210 zone forms the most immediate resistance cluster, coinciding with the 200 day Exponential Moving Average on shorter timeframes. Below this, the psychological $2,000 mark is acting as a major battleground. If ETH manages to reclaim and hold the $2,100 to $2,210 area, the next significant resistance lies around $2,500 to $2,550, followed by a heavier supply zone near $2,757 to $2,800.
The short term market outlook remains bearish below $2,100. A weekly close under $2,000 could target $1,850, while reclaiming $2,100 is absolutely necessary to alleviate the selling pressure. The worst case scenario, highlighted by multiple analysts, points toward $1,736 to $1,750 if current supports break down. This area would serve as a major structural support level for the long term.
However, a strong fundamental factor tempers this gloomy technical picture. The Ethereum mainnet processed over 200 million transactions in Q1 2026, representing a 43% increase from the previous quarter. This surge was driven by a massive 1,704% jump in active addresses fueled by the expansion of Layer 2 networks. On chain adoption is accelerating while the price consolidates. Historically, this type of decoupling has often preceded significant market recoveries once macroeconomic conditions normalize.
Can ETH reverse the trend?
Our take on the current situation is that the short term risk to reward ratio for Ethereum does not favor immediate buyers. The conditions for a rebound certainly exist, including record on chain adoption and two major network upgrades scheduled for 2026. Long term price targets remain highly optimistic among institutional analysts, but these require a favorable external catalyst. Whether it comes from an easing of geopolitical tensions or a dovish signal from the Fed, an external trigger is needed to translate into actual price appreciation.
The decisive factor remains reclaiming the $2,150 level with sustained buying volume. Without this breakout, a test of $1,900 remains the baseline scenario for the upcoming weeks, featuring a major structural support identified at $1,736 for long term buyers on exchanges. The decisive factor remains reclaiming the $2,150 level with sustained buying volume. Without this breakout, a test of $1,900 remains the baseline scenario for the upcoming weeks, featuring a major structural support identified at $1,736 for long term buyers on exchanges.
Sources:
Related Articles:

