

ETH at $2,050: What you really need to watch
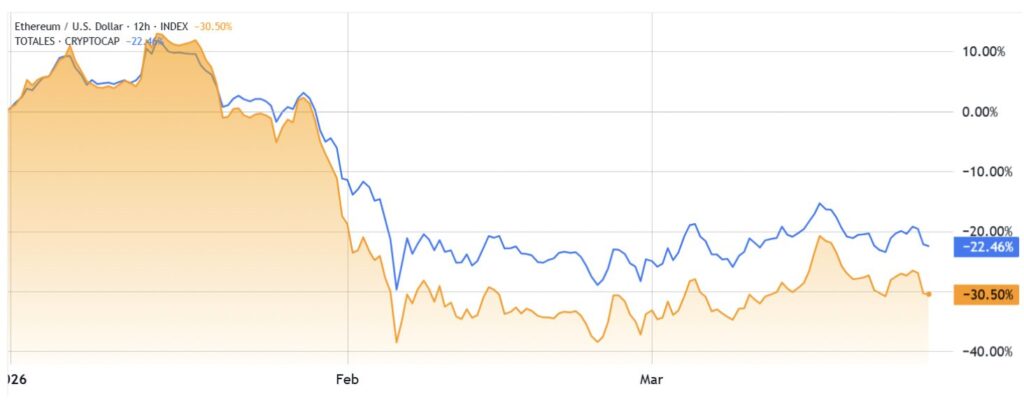
Ethereum is going through an uncomfortable compression phase. Following a 6% pullback that dragged the price back into the $2,050–$2,070 zone, the asset remains under pressure in a market that is nevertheless starting to show some signs of stabilization on Bitcoin. This decoupling is not insignificant. Since January 2026, ETH has posted a 31% underperformance, a figure that reflects a temporary disaffection of risk capital rather than a structural weakness of the protocol.
Three metrics are currently capturing the attention of analysis desks. Their evolution over the coming weeks will be decisive in determining whether ETH can trigger a reversal or if the corrective scenario will settle in for the long term.
Spot ETFs: The institutional tap remains closed
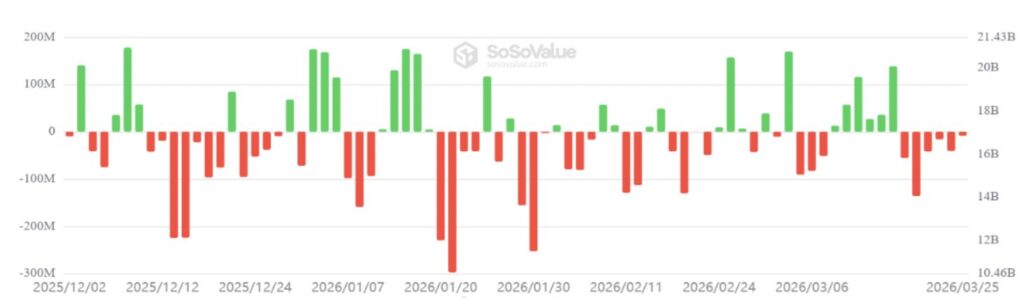
The first warning sign comes from the flows. After attracting roughly $70 billion over the past two years, US spot Ethereum ETFs hit a wall in early 2026, posting cumulative net outflows of around $32 million, a brutal reversal. On ETH specifically, Ethereum ETFs recorded approximately -$210 million in net outflows between March 5 and March 10, extending a streak of consecutive redemptions that directly weighs on the price.
What is important to understand here is that ETFs are not just an additional investment channel: they now constitute a fully fledged price discovery vector. During periods of net redemptions, Authorized Participants must sell ETH from the fund’s treasury to reimburse exiting shareholders, creating mechanical selling pressure on the spot market. As long as this tap remains closed, rallies will be limited in magnitude.
DEX activity, the pulse of real utility
The second indicator concerns on-chain activity. DEX volumes on Ethereum are hovering around $904 million over 24 hours, with a weekly drop of -4.66%, illustrating a slowdown in demand for decentralized applications. The drop in volumes mechanically translates into fewer transactions, fewer fees burned via EIP-1559, and therefore a slightly inflationary pressure on the circulating supply, depriving ETH of a structural support that the market had taken for granted since the Merge.
For context, periods of sustained rallies on ETH have historically coincided with peaks in DeFi activity. A rebound in volumes on major protocols like Uniswap, Aave, or Curve would be a serious early signal to consider before taking any aggressive bullish position.
Futures premium: The leverage thermometer
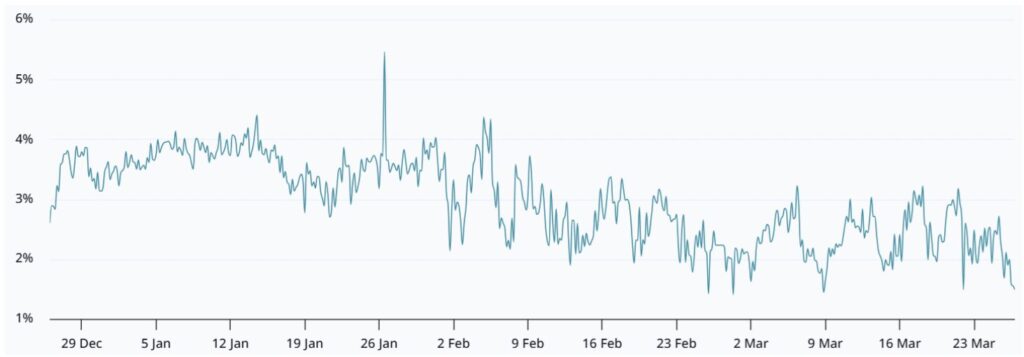
The third point of vigilance is the dynamics of derivatives. The funding rate for ETH perpetual futures recently slipped into negative territory. This signals a shift toward seller dominance. Short sellers are now paying longs to keep their positions open. This reversal comes as ETH continues to underperform parts of the market and struggles to build momentum above key resistances.
Paradoxically, this is a metric with a dual interpretation: a negative funding rate does not automatically guarantee a continuation of the decline. However, it shows that traders are positioning themselves defensively in the short term. A low leverage market is also a market less vulnerable to a violent flush. The floor is potentially more solid, but the rebound will be slower to initiate.
Our reading of the setup
The $2,050 support is the absolute pivot level to watch. The $1,837–$1,940 zone represents the next major support cluster, aligned with the March 2026 lows and the historical accumulation zones of Q4 2024. Holding this level on a daily close is not negotiable to maintain a neutral to bullish bias.
For a recovery scenario to truly take hold, it will first be necessary to reclaim $2,200, a resistance that has already rejected several attempts. Beyond this threshold, $2,500 represents a major psychological and structural barrier. Meanwhile, the $2,700–$2,800 zone constitutes the last significant supply zone. Momentum indicators like the RSI and the MACD will be crucial to confirm this move.
Personally, I would not be an aggressive buyer before confirmation above $2,200 with volume. The current zone may represent a progressive accumulation opportunity for long term investors, but it does not yet constitute an entry signal for a momentum trade. Notably, Ethereum surpassed 2 million daily active addresses in February 2026, beating the peak of the 2021 bull market, while smart contracts calls exceeded 40 million per day. A useful reminder that the fundamental thesis remains intact, even if the price does not reflect it yet. The market is testing patience. This is often when the least rational decisions are made.
Sources:
Related Articles:

