

Whales Resume Massive Ethereum Positions
The activity of large Ethereum addresses has seen a spectacular surge in recent days. Blockchain data shows that wallets holding more than 10,000 ETH have significantly increased their positions. This strategic accumulation by whales coincides with a period when many retail investors were still expressing doubts about ETH’s ability to rebound.
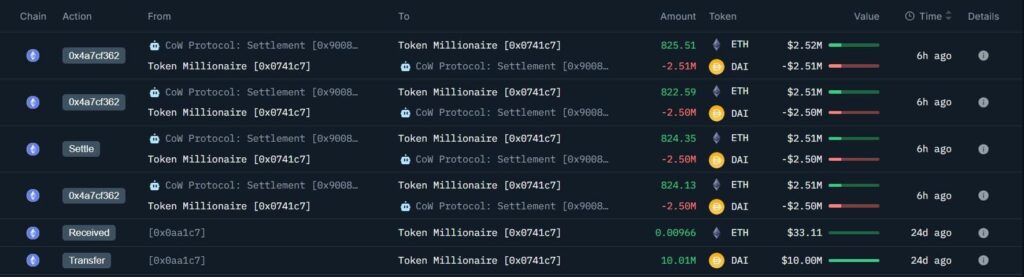
Large transactions are multiplying on exchanges, but unlike distribution periods, these movements primarily correspond to withdrawals to private wallets. This pattern clearly indicates an intention to hold for the medium and long term rather than a desire to sell quickly. Whales appear to be anticipating a significant appreciation in price in the coming weeks.
The timing of this accumulation is likely not coincidental. Several analysts note that whales typically accumulate when market sentiment reaches extreme fear levels. Technical indicators also show that ETH was trading in an oversold zone before this rebound, creating an attractive buying opportunity for institutional investors and large holders.
The $47 Million Inflow Completely Reverses the Trend
The $47 million injected into the Ethereum spot market represents a major bullish signal. Unlike derivatives markets where leverage artificially amplifies volumes, spot purchases reflect real demand and generate sustained buying pressure on price.
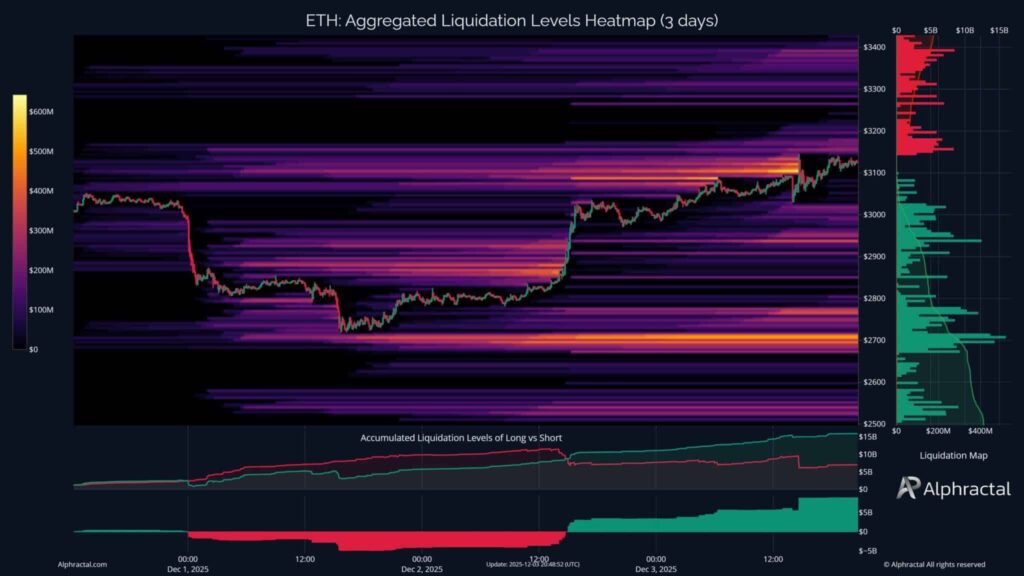
This wave of purchases triggered a cascade of short position liquidations. Bearish traders using leverage were forced to buy back their positions to limit their losses. This short squeeze phenomenon amplified the initial bullish move, creating a positive feedback loop that propelled the price well beyond expectations.
On-chain analysis platforms confirm that these flows primarily come from new entrants rather than redistributions between existing addresses. This injection of fresh capital demonstrates renewed confidence in Ethereum’s potential. Volume metrics also show that trading activity has surged, signaling renewed engagement from investors toward ETH.
Is ETH’s Bottom Confirmed by Technical Analysis?
Technical indicators converge toward a scenario where Ethereum has indeed touched its bottom. The RSI has exited its oversold zone while maintaining enough room for a bullish continuation. Moving averages are beginning to flatten after weeks of downward slope, suggesting a weakening of the bearish trend.
Price structure also reveals encouraging signals. ETH has formed a series of higher lows after breaking a major support, a classic trend reversal pattern. Volume accompanies this movement, which strengthens the validity of the current rebound. Fibonacci levels indicate that the next significant resistance sits approximately 15% above current prices.
However, caution remains warranted. To definitively confirm the bottom is established, Ethereum will need to break through several resistance zones where significant selling liquidity concentrates. The next trading sessions will be decisive in determining whether this rebound marks a new bullish dynamic or represents merely a temporary technical bounce within a broader bearish trend.
Related articles:

