Exploring the Stagnation of Pi Coin: What’s Hindering Its Bullish Momentum?
Touted as the "Bitcoin mobile" a few years ago, Pi Coin appeared poised for success. However, with a stagnant mainnet, minimal liquidity, and waning trust, investors are questioning if Pi missed its momentum. Join the conversation on InvestX.fr/en for more insights.
MACD and OBV for pi: Two Indicators Telling Opposite Stories
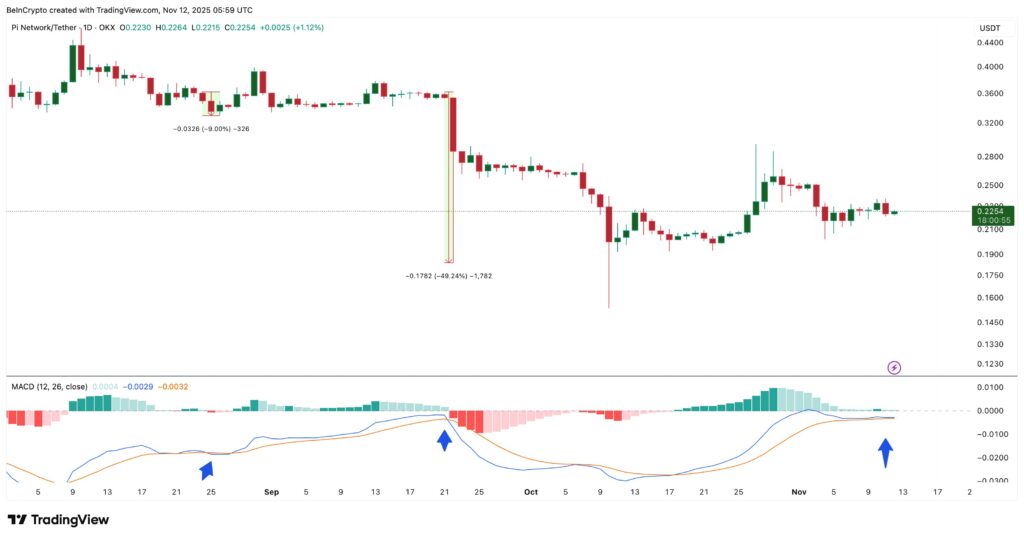
The daily chart of Pi Coin presents a concerning technical configuration at the MACD level. This momentum indicator shows signs of weakness after several weeks spent above its signal line. The recent history leaves no room for doubt. Indeed, the last two bearish crossovers that occurred on August 25th and September 21st triggered corrections of 9% and 49% respectively.
If a new bearish crossover forms in the coming days, Pi Coin could experience similar selling pressure. Experienced traders are closely monitoring this zone, as it has systematically marked the beginning of distribution phases in recent months.
Paradoxically, the OBV indicator is attempting to tell a different story. This tool, which measures volume strength based on price movements, has remained under a descending resistance since early October, confirming the dominance of sellers. However, each test of this trend line has generated small technical bounces, notably the 8% increase observed on November 10th.
Pi Coin’s OBV remains negative but is beginning to show a slight bullish inflection. This signal suggests that some buyers are cautiously testing the market. A breakout above the OBV resistance line could neutralize the bearish setup of the MACD and pave the way for a more solid recovery.
A Symmetrical Triangle Compresses Price Before Final Decision
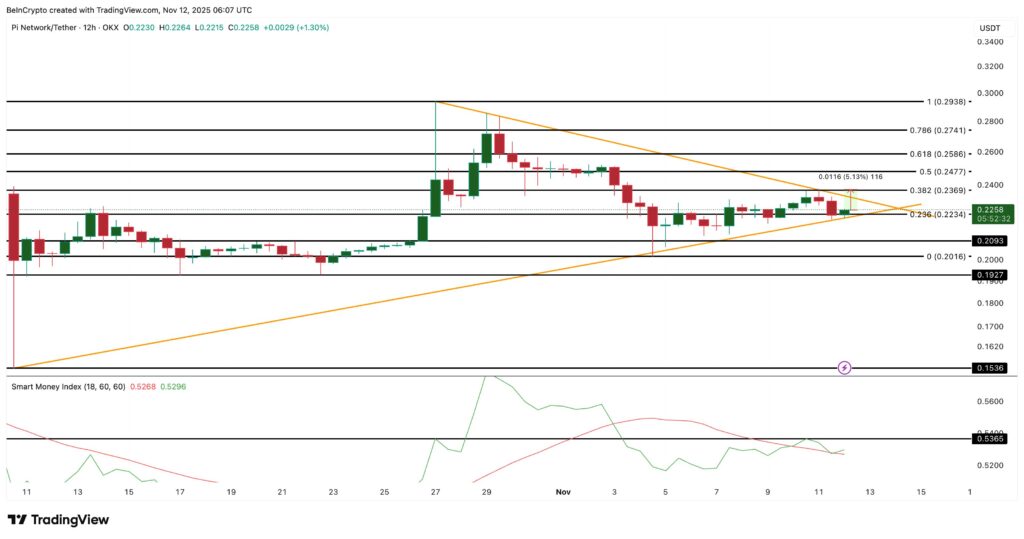
The 12-hour chart reveals a classic but explosive technical pattern: a symmetrical triangle. Pi Coin’s price is currently moving between an ascending support line and a descending resistance, progressively compressing volatility. This configuration visually reflects market indecision and typically precedes a significant directional move.
The key levels to monitor are now well-defined. A close above $0.23 would confirm a bullish breakout and open the path toward $0.25, with a possible extension up to $0.27 if momentum accelerates. Conversely, if the lower support near $0.20 gives way, Pi Coin could quickly revisit $0.19 before potentially testing the critical zone of $0.15.
The Smart Money Index brings an interesting nuance to this analysis. This indicator, which tracks institutional investor and whale movements, bounced off its signal line on November 11th. While this is not yet a complete reversal signal, this movement suggests that some large portfolios are beginning to anticipate a rebound and are discretely accumulating positions.
The convergence of several technical factors could soon force Pi Coin to break out of its triangle. If the Smart Money Index forms a higher high and the OBV breaks through its resistance ceiling, bullish momentum could finally materialize. Otherwise, the MACD’s bearish pressure risks regaining control and triggering another leg of correction.
Passionate about the crypto world, he explores the blockchain ecosystem to extract the most essential insights. With his expertise in SEO and web writing, he transforms news and technical analysis into clear, engaging, and impactful content. His goal? To help investors better understand the opportunities and challenges of the crypto market.
DISCLAIMER
This article is for informational purposes only and should not be considered as investment advice. Some of the partners featured on this site may not be regulated in your country. It is your responsibility to verify the compliance of these services with local regulations before using them.
DISCLAIMER
This article is for informational purposes only and should not be considered as investment advice. Trading cryptocurrencies involves risks, and it is important not to invest more than you can afford to lose.
InvestX is not responsible for the quality of the products or services presented on this page and cannot be held liable, directly or indirectly, for any damage or loss caused by the use of any product or service featured in this article. Investments in crypto assets are inherently risky; readers should conduct their own research before taking any action and invest only within their financial means. This article does not constitute investment advice.
Risk Warning : Trading financial instruments and/or cryptocurrencies carries a high level of risk, including the possibility of losing all or part of your investment. It may not be suitable for all investors. Cryptocurrency prices are highly volatile and can be influenced by external factors such as financial, regulatory, or political events. Margin trading increases financial risks.
CFDs (Contracts for Difference) are complex instruments with a high risk of rapid capital loss due to leverage. Between 74% and 89% of retail investor accounts lose money when trading CFDs. You should assess whether you understand how CFDs work and whether you can afford to take the high risk of losing your money.
Before engaging in financial or cryptocurrency trading, you must be fully informed about the associated risks and fees, carefully evaluate your investment objectives, level of experience, and risk tolerance, and seek professional advice if needed. InvestX.fr and the InvestX application may provide general market commentary, which does not constitute investment advice and should not be interpreted as such. Please consult an independent financial advisor for any investment-related questions. InvestX.fr disclaims any liability for errors, misinvestments, inaccuracies, or omissions and does not guarantee the accuracy or completeness of the information, texts, graphics, links, or other materials provided.
Some of the partners featured on this site may not be regulated in your country. It is your responsibility to verify the compliance of these services with local regulations before using them.
Get 6200 USDT with Bitget ! 🔥
Don't miss out on this offer !
Create your account now to unlock this exclusive reward