

Crypto Market and Bitcoin Catch Their Breath
After months of relentless decline and sluggish activity, Shiba Inu is finally showing encouraging signs of a potential trend reversal. Meanwhile, Solana continues its quiet ascent, while speculation around Bitcoin breaking the $120,000 mark fuels ongoing debates.
Behind these contrasting developments lies the hope for renewed energy across the entire crypto market. Let’s break down these key movements that could shape the weeks ahead.
SHIBA INU (SHIB) : Heading Toward a Major Trend Reversal ?
After months of consolidation and low activity, Shiba Inu, one of the most popular memecoins, is finally showing signs of a bullish reversal. Currently, SHIB trades around $0.000012, initiating a modest yet encouraging recovery movement.
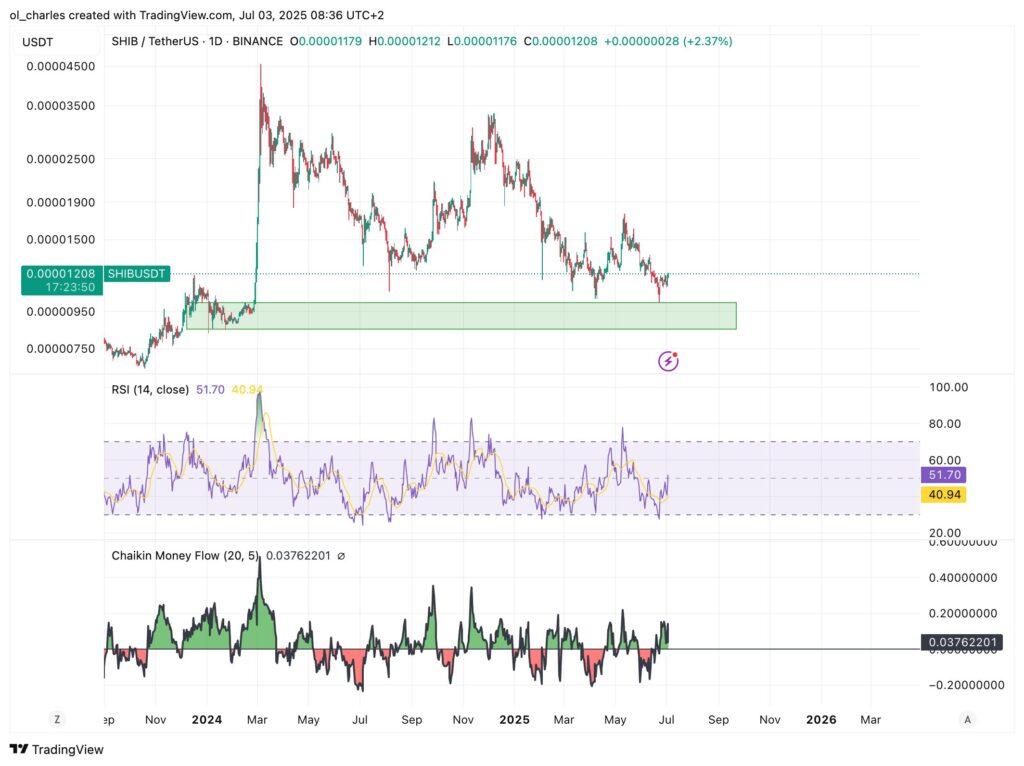
Here are the key elements for SHIB :
- The key support between $0.0000095 and $0.0000110 has so far absorbed selling pressure effectively.
- The RSI is gradually climbing toward the neutral zone around 42, leaving oversold territory.
- Major technical resistance sits at $0.00001286, at the 50-day exponential moving average (EMA50). Breaking this level would reignite the short-term bullish trend.
If SHIB manages to sustainably break through this zone, it could confirm a transition to a more durable recovery phase. However, current volumes remain low, raising concerns about a potential “dead cat bounce” among some traders.
SOL : The Cryptocurrency Making a Strong Comeback
Solana continues its upward trajectory without experiencing the famous golden cross – the signal often viewed as a powerful bullish momentum indicator.
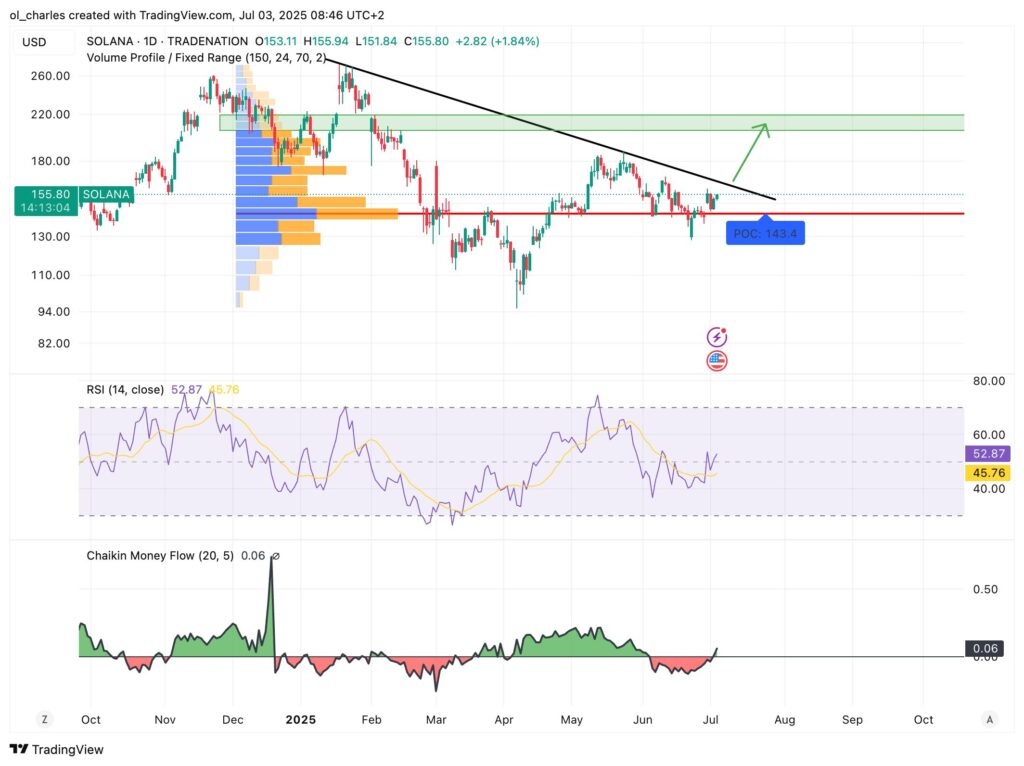
Here are the key elements to watch for Solana :
- The support at $140 has held strong for several weeks.
- SOL’s price currently hovers around $155, maintaining a structure of higher highs and higher lows.
- The $160-$180 zone represents cumulative resistance, at the confluence of the 100 and 200-day moving averages.
Although Solana’s RSI remains moderate at 48, relatively stable volumes and discreet accumulation by “whales” support the hypothesis of continued upward momentum. A break above $180 would almost guarantee an extended bullish trend.
Key levels to watch for SOL :
- Support to maintain : $140
- Resistance to break : $160 to $165, then $170 to confirm a medium-term breakout
BITCOIN (BTC) : Heading Toward a Break of $120,000?
Bitcoin returns to the center of speculation as it flirts with a pivotal resistance zone between $110,000 and $112,000, a technical threshold that could trigger a surge toward the famous psychological target of $120,000.
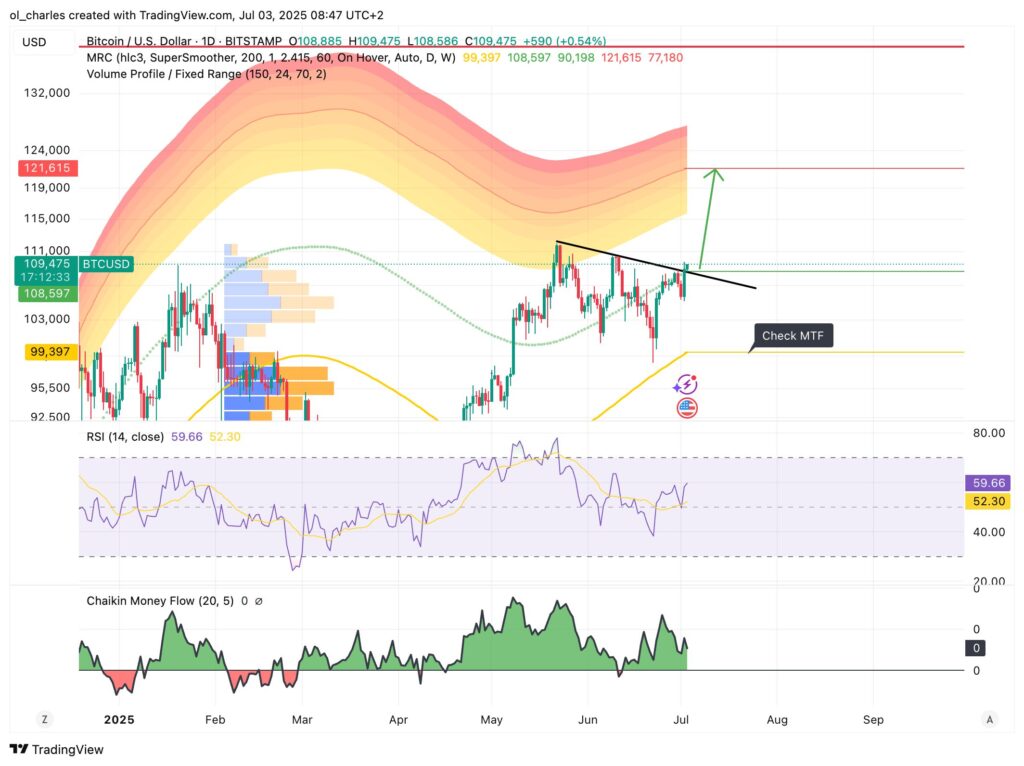
Consolidation or preparation for a bullish breakout ?
- BTC currently trades around $109,400, in the midst of breaking out from its bearish trend.
- Since April’s low at $78,000, the ascending structure suggests discreet accumulation.
- The neutral RSI around 57 suggests increased volatility in the coming days.
However, caution remains warranted: volume remains sluggish, far from past peaks. If it fails to break through $112,000, a return to the 100-day moving average, near $100,500, could unfold.
The market seems to be accumulating momentum, but the true bullish impulse is still awaited.
Caution remains essential, especially in a context where volumes have yet to confirm a widespread recovery. However, breaking through the mentioned resistance levels could quickly change the landscape.

