

On-Chain Metrics Point to Strategic Accumulation
The question of Bitcoin ‘s potential rally toward $115,000 is capturing the attention of traders and institutional investors. After several months of consolidation and marked volatility, the world’s leading cryptocurrency is displaying technical signals that warrant thorough analysis. On-chain data reveals significant liquidity movements that could indicate a shift in market sentiment in the short and medium term.
On-chain data now represents one of the most reliable indicators for assessing the real health of the Bitcoin network. Current metrics show progressive accumulation from long-term holders, a signal historically correlated with pre-rally phases. The active address ratio has increased consistently over recent weeks, suggesting renewed interest from both retail and institutional investors.
Over 4,000 BTC have left exchanges, which often indicates long-term confidence from major investors.
Liquidity on major exchanges is improving in parallel, providing fertile ground to absorb growing demand without causing excessive slippage. Spot trading volumes are gradually increasing while derivatives dominance is stabilizing, a balance favorable to sustainable price progression rather than volatile speculative surges.
Macroeconomic Factors Create a Favorable Environment
The global macroeconomic context plays a determining role in Bitcoin’s potential trajectory toward $115,000. Central bank monetary policies, particularly from the Fed and ECB, directly influence appetite for risk assets and alternative safe havens. The prospect of a pause in the US rate hike cycle could redirect capital toward digital assets.
The government shutdown could also be nearing its end and the third FOMC meetings are scheduled for early December. This could add more fuel to the fire for Bitcoin.
Technical Resistance and Critical Zones to Watch
Technical analysis reveals several crucial price levels to validate the bullish scenario toward $115,000. Psychological resistance levels at $108,000 and $111,000 represent potential profit-taking zones where volatility could intensify temporarily. Confirmed breakthrough of these thresholds with sustained volumes would constitute a major technical signal.
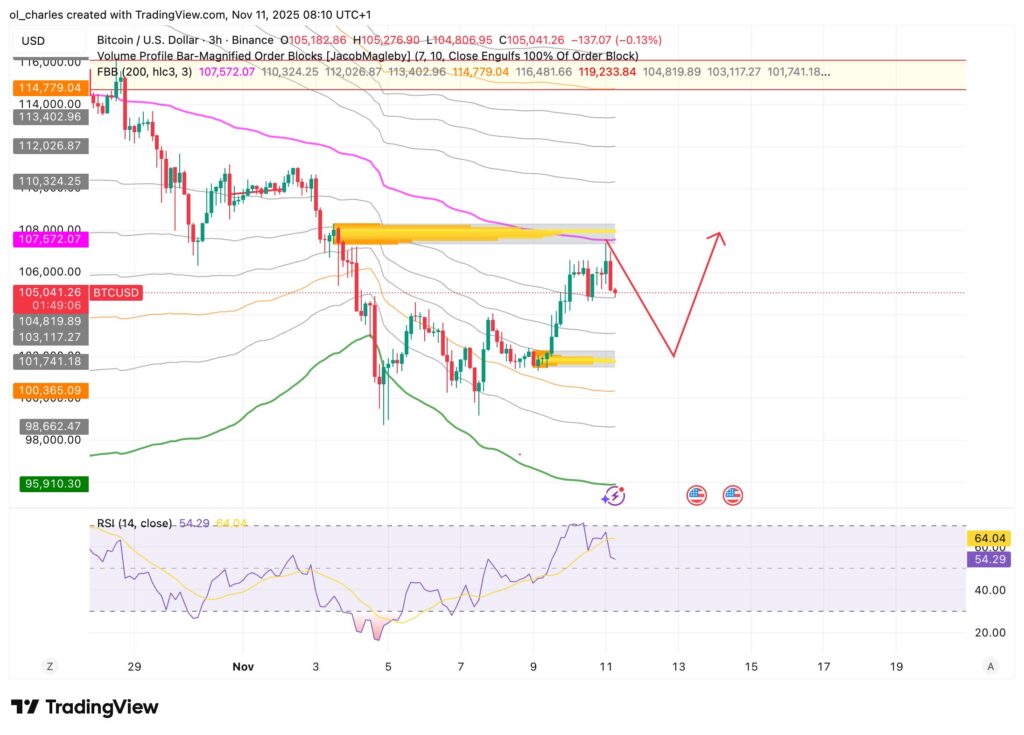
In the short term, BTC has been rejected from a liquidity zone according to the Order Block between $107,400 and $108,500. A pullback to its lower demand zone around $102,000 should therefore be considered.
In this zone, a rebound is highly probable. Bitcoin could therefore retest this resistance zone. If BTC breaks through this zone, it will head to $109,000 then $111,000. Maintaining above $110,000 could allow BTC to target the shorts at $115,000.
Conversely, a drop below $101,000 would push BTC toward new lows. A bounce at $103,600 is also possible, this is a zone to monitor.
Should You Buy Now?
In a chaotic crypto market, 16 free Pionex bots transform your BTC/ETH into passive yield 24/7, without stress or perfect timing.
The Grid Bot explodes returns in range: up to 180% annualized on BTC/ETH, proven by thousands of users. DCA, Arbitrage, Rebalancing: even in sideways or bear markets, your bots capture every oscillation automatically, without doing anything.
Pionex has processed billions in volume, it’s the secret weapon of pros to multiply their BTC/ETH in passive mode. Join the best traders now: activate your free bots and watch your cryptos deliver profits regardless of market direction:
Related Articles:

