

John Bollinger Detects Reversal Signals on ETH and SOL
John Bollinger, a living legend of technical analysis and creator of the eponymous indicator used by millions of traders worldwide, has just sounded the alarm on two major crypto market assets. In a recent statement that sparked community reaction, the analyst claims that Ethereum (ETH) and Solana (SOL) are showing bullish reversal signals after a particularly violent correction. For this expert who has navigated several decades of financial markets, the time has come to “pay attention” to these two cryptocurrencies.
Bollinger’s statement comes amid high volatility where many investors are trying to identify the market floor. Bollinger Bands, a technical indicator measuring volatility and overbought or oversold levels, appear to indicate that ETH and SOL have reached critical price zones that could trigger a significant rebound.
Buy your ETH and SOL now before they explode on Bitget and receive $10 free in just a few clicks here:

Bollinger Bands Detect Extreme Compression on ETH
Ethereum is currently going through a delicate but promising technical phase according to Bollinger’s analysis. After falling to major support levels, the second-largest crypto market cap shows unusual volatility compression. This phenomenon, visible when the upper and lower bands tighten, typically precedes a violent price movement in one direction or the other.
On-chain data corroborates this technical reading. Trading volume on ETH has significantly decreased in recent weeks, a typical sign of quiet accumulation before a breakout. The support zones around which ETH currently oscillates correspond to historically solid levels where institutional buyers have traditionally intervened.
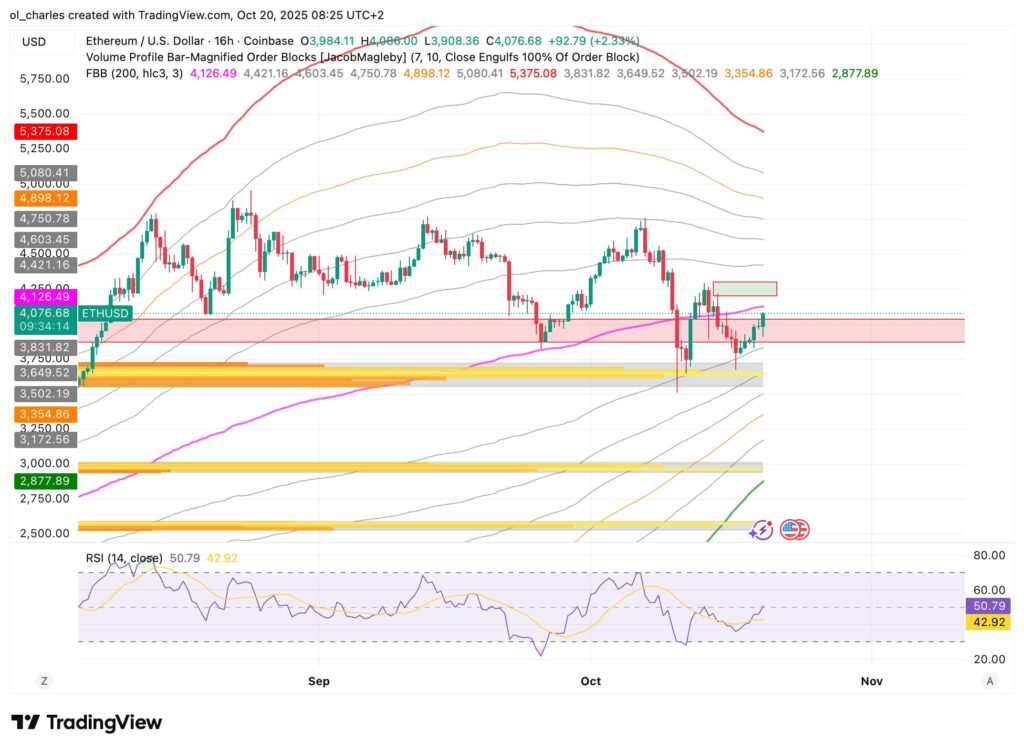
Ethereum’s price action also shows a series of higher lows, a classic technical structure of a potential trend reversal. Attentive traders are watching the immediate resistance at $4,130 which, if broken with volume, could trigger a cascade of buy orders and propel the price toward significantly higher zones.
Solana Shows Bullish Divergences After Brutal Correction
Solana has not been spared by the wave of selling that has shaken the crypto market. However, technical analysis reveals encouraging signals that Bollinger immediately identified. SOL currently presents a bullish divergence on several momentum indicators, notably the RSI and the MACD, suggesting that selling pressure is waning despite falling prices.
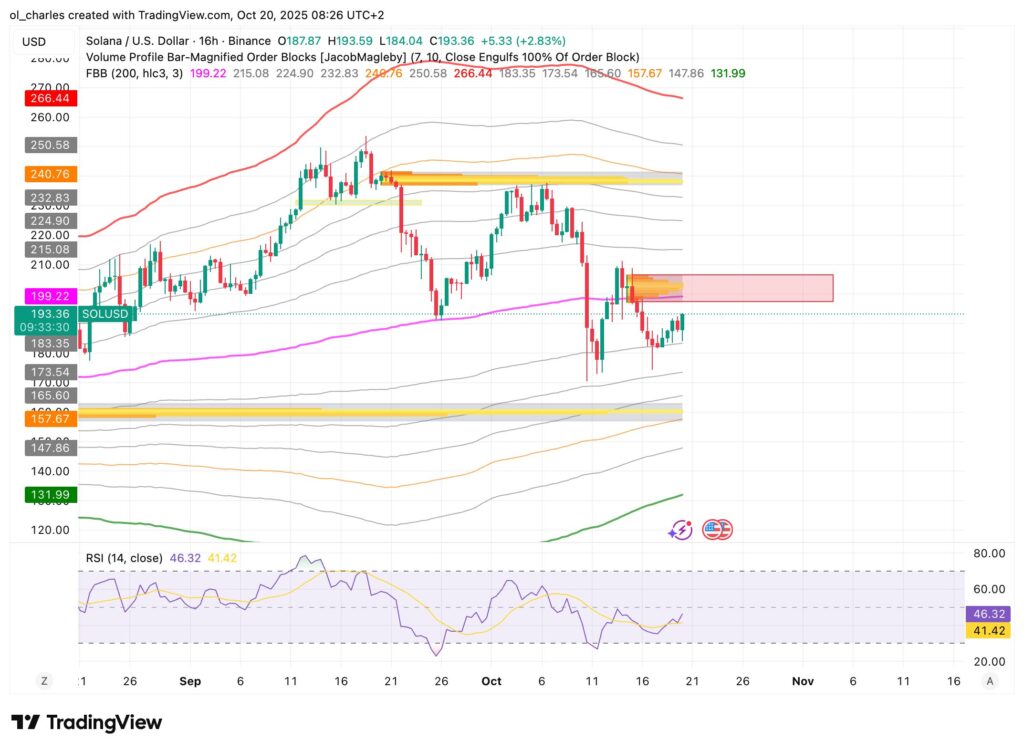
This rare technical configuration often indicates that a bottom is forming. The price continues to fall or stagnate, but momentum indicators are already starting to rise, betraying a weakening of sellers and a gradual strengthening of buyers. Current price zones on SOL correspond to key Fibonacci retracement levels, closely monitored by professional traders.
Market sentiment around Solana remains mixed, but accumulation volumes on the network’s decentralized exchanges are increasing, a sign that seasoned investors are taking advantage of these levels to position themselves.
Nevertheless, the VP Order Block indicates heavy selling between $197 and $207, a resistance zone that could immediately halt progress and hopes for Solana.
For ETH and SOL, a cautious approach involves waiting for a clear breakout of resistance with increased volume before entering a position. Stop-losses should be placed below the last significant lows to limit exposure in case of a false breakout. Money management remains key in an environment where volatility can quickly erase poorly secured gains.
On the same topic:

