

When Historical Bitcoin Whales Awaken from Their Slumber
The movement of 4,657 Bitcoin from wallets dormant for three to five years constitutes a major on-chain signal. This cohort of holders typically corresponds to early investors from the previous bull cycle or strategic holders. These individuals have weathered several bear markets. When these coins move after years of inactivity, it rarely signals panic selling. Instead, it indicates a calculated rotation of allocations.
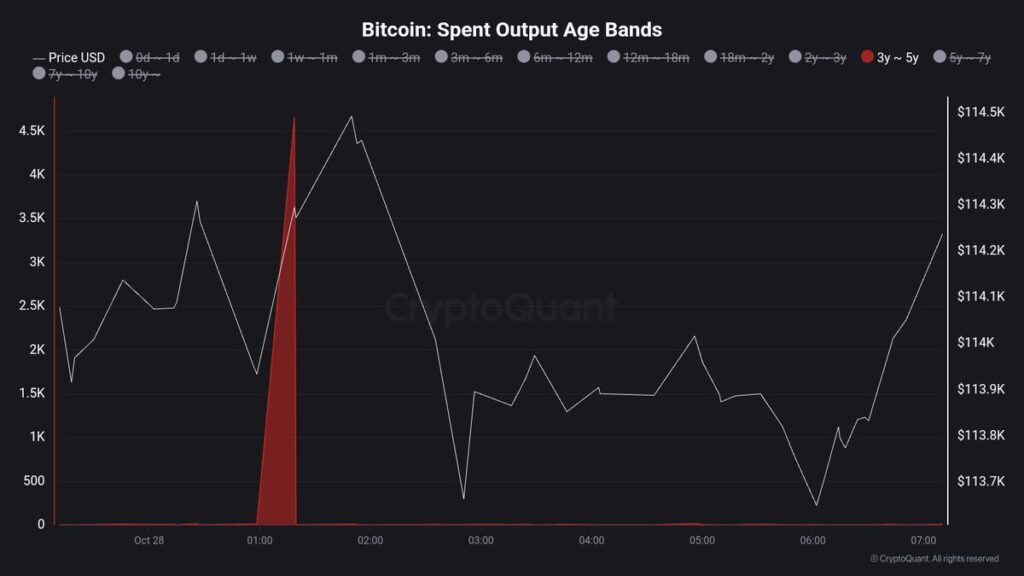
Bitcoin’s history shows that similar awakenings of long-term supply have preceded important structural changes. During past consolidation phases, these reactivations occurred as experienced investors prepared for increased volatility. This was either to secure profits near local tops or to reposition before a trend reversal. The magnitude of the current movement indicates that historical whales are reassessing their positions in anticipation of the imminent interest rate decision.
What makes this situation particularly interesting is the contrast with current market sentiment. Despite increased activity from long-term holders, on-chain indicators like the Bull-Bear Structure Index and the Unified Sentiment Index remain in a moderately bullish zone. This implies that while some early adopters are taking profits or reallocating assets, the overall market conviction continues to improve. This is particularly evident with Bitcoin holding above the crucial support of $113,000-$114,000.
🎁 Claim your Bitget bonus with your first crypto purchase!

Technical Structure Confirms a Bullish Medium-Term Bias
On the three-day chart, Bitcoin is currently trading near $114,485, displaying a solid recovery since October’s sell-off. The technical structure reveals that the price firmly maintains above the 50-day and 100-day moving averages. This is a key structural signal confirming the integrity of the medium-term trend despite recent volatility.
The next major resistance level sits at $117,500, a zone that has systematically hindered Bitcoin’s advances over the past two months. A successful breakout with a daily close above this threshold could pave the way for a test of $125,000, potentially marking the beginning of a significant new bullish impulse. However, rejection at this level could trigger another short-term consolidation phase, with traders taking profits within this range amid persistent macroeconomic uncertainty.
To the downside, immediate support is positioned around $111,000-$112,000. Meanwhile, the 200-day moving average near $96,000 continues to provide solid long-term structural support. Momentum indicators combined with on-chain data, including sentiment recovery and stable liquidity conditions, suggest that buying interest is gradually returning to both spot and derivatives markets.
On the same topic:

