

Support at $2.10 Under Close Watch
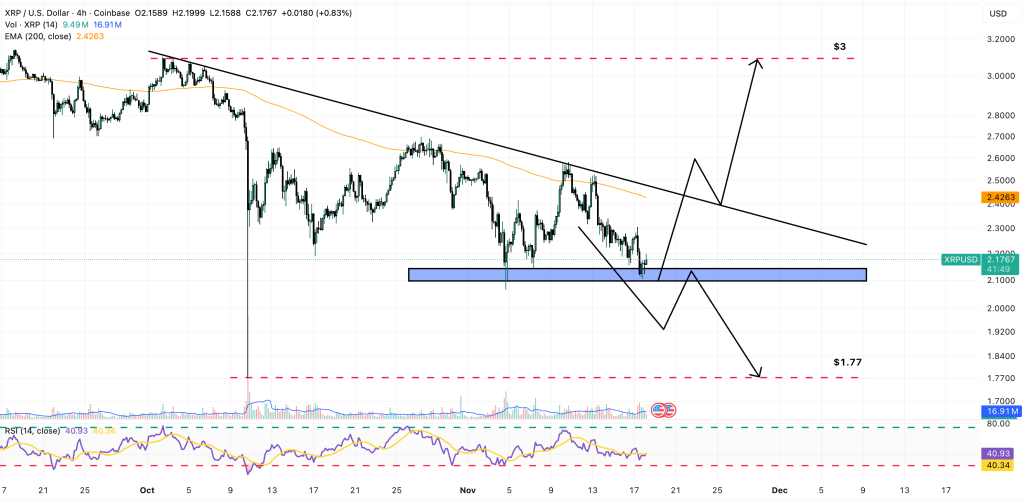
From a technical perspective, XRP is down 3.6% over the past 24 hours, breaking below the psychological threshold of $2.20. The weekly loss now stands at 11%, erasing a substantial portion of the gains accumulated during November’s rally. Chart analysis reveals the formation of a descending triangle on the 4-hour timeframe, a pattern typically interpreted as a bearish continuation signal.
The current support level at $2.10 represents a critical defense zone for buyers. A breakdown below this threshold could trigger a cascade of stop-losses and propel the price toward $1.77, representing an additional 16% correction from current levels. This zone would correspond to a significant Fibonacci retracement and would constitute an attractive entry point for medium-term investors.
Conversely, a decisive bounce above the upper trendline of the triangle would invalidate the bearish scenario and pave the way for a bullish recovery. Traders are closely monitoring trading volumes, a key indicator to confirm the direction of the next price movement. A bullish breakout accompanied by rising volumes would signal a return of risk appetite.
Macroeconomic Factors Weigh on Sentiment
Beyond technical analysis, several fundamental elements explain this consolidation phase. The macroeconomic environment remains tense, with persistent inflation data complicating Fed decisions. Markets have priced in a more hawkish scenario than expected, which removes fuel from speculative assets like XRP.
The correlation between XRP and traditional equity indices remains high, reflecting the risk-on/risk-off behavior of institutional investors. As long as uncertainty persists regarding the trajectory of interest rates, flows into crypto ETPs will likely remain volatile. Upcoming economic releases, particularly employment and inflation figures, will be crucial for short-term market direction.
Related articles:

