Will ONDO Explode Like Mantra (OM) ? Technical Analysis & Price Prediction
As Mantra (OM) has surged 1000% in 12 months, its counterpart ONDO appears poised to mirror this extraordinary growth. Explore how fractal analysis uncovers early indicators of an upcoming bullish rally.
ONDO vs. Mantra (OM) : Can ONDO Replicate OM’s 1000% Surge ?
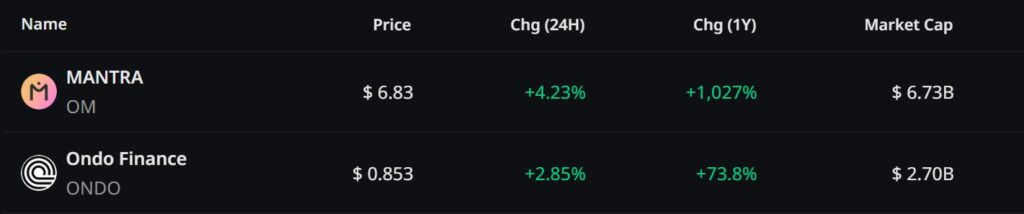
In the realm of cryptocurrencies, when it comes to highlighting the top performers in the narrative of real-world assets (RWA), Mantra (OM) takes the spotlight. Over the last 12 months, OM has indeed delivered a staggering 1000% surge, establishing itself as one of the biggest winners in the RWA sector. In contrast, ONDO (ONDO) – another major token – has only seen a relatively modest gain of 73% during the same period.
However, the current comparison of the fractal curves of OM and ONDO suggests that ONDO might be on the verge of catching up with OM’s explosive bullish action.
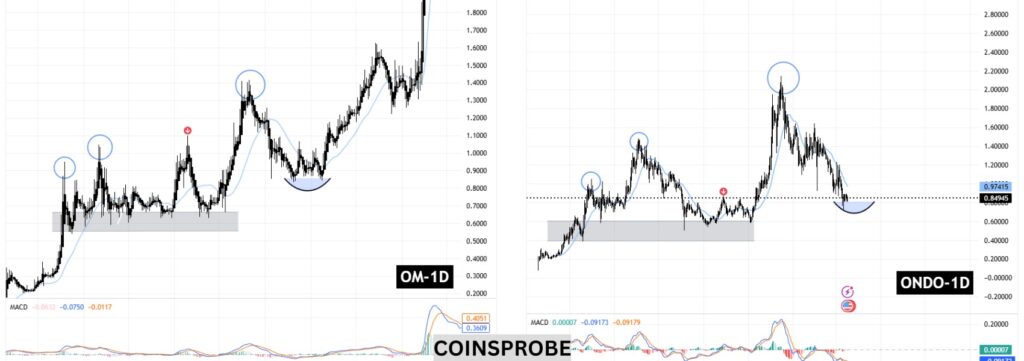
Upon closer examination of OM’s daily chart since August 2024, it is evident that OM went through a deep correction phase after reaching local highs. This phase was then followed by a strong trend reversal, eventually leading to a massive rally – propelling OM from nearly $0.85 to a new all-time high of $9.17.
Interestingly, ONDO’s current price evolution seems to be following a very similar path :
It recently underwent a healthy correction phase and is now building a strong support around $0.85.
The current structure resembles the same type of consolidation and turnaround that OM experienced before its breakthrough.
The 25-day moving average on ONDO’s chart is also positioned similarly to how it was for OM before its rally.
Source : Coinsprobe / TradingView
These similarities resonate with what is known as a fractal pattern – where past price structures tend to repeat in a similar manner, if not exactly the same.
Could ONDO Be the Next Big Winner in RWA, Following OM’s Rally ?
While no one can predict market movements with certainty, this type of fractal setup often catches the eye of traders and technical investors. If ONDO manages to break through its immediate resistance levels, it could trigger a powerful bullish move, much like what OM did at the start of its breakthrough.
With RWA tokens gaining prominence in 2025, ONDO could very well be the next standout – especially if this graphical pattern continues to unfold similarly.
Gaston has been a writer for over 7 years and a passionate cryptocurrency enthusiast since 2020. He loves exploring the crypto ecosystem and is now dedicated to sharing his insights and discoveries through InvestX.
DISCLAIMER
This article is for informational purposes only and should not be considered as investment advice. Some of the partners featured on this site may not be regulated in your country. It is your responsibility to verify the compliance of these services with local regulations before using them.
DISCLAIMER
This article is for informational purposes only and should not be considered as investment advice. Trading cryptocurrencies involves risks, and it is important not to invest more than you can afford to lose.
InvestX is not responsible for the quality of the products or services presented on this page and cannot be held liable, directly or indirectly, for any damage or loss caused by the use of any product or service featured in this article. Investments in crypto assets are inherently risky; readers should conduct their own research before taking any action and invest only within their financial means. This article does not constitute investment advice.
Risk Warning : Trading financial instruments and/or cryptocurrencies carries a high level of risk, including the possibility of losing all or part of your investment. It may not be suitable for all investors. Cryptocurrency prices are highly volatile and can be influenced by external factors such as financial, regulatory, or political events. Margin trading increases financial risks.
CFDs (Contracts for Difference) are complex instruments with a high risk of rapid capital loss due to leverage. Between 74% and 89% of retail investor accounts lose money when trading CFDs. You should assess whether you understand how CFDs work and whether you can afford to take the high risk of losing your money.
Before engaging in financial or cryptocurrency trading, you must be fully informed about the associated risks and fees, carefully evaluate your investment objectives, level of experience, and risk tolerance, and seek professional advice if needed. InvestX.fr and the InvestX application may provide general market commentary, which does not constitute investment advice and should not be interpreted as such. Please consult an independent financial advisor for any investment-related questions. InvestX.fr disclaims any liability for errors, misinvestments, inaccuracies, or omissions and does not guarantee the accuracy or completeness of the information, texts, graphics, links, or other materials provided.
Some of the partners featured on this site may not be regulated in your country. It is your responsibility to verify the compliance of these services with local regulations before using them.
Get 6200 USDT with Bitget ! 🔥
Don't miss out on this offer !
Create your account now to unlock this exclusive reward