

Technical Indicators Point Toward a Reversal Pattern
Analysis of the two-day chart reveals a massive accumulation phase that has extended throughout most of 2024. PEPE has consolidated within a horizontal range between $0.0000075 and $0.0000090 for months. This allows institutional investors and whales to accumulate positions without significantly moving the price. This consolidation base represents a solid foundation for a large-scale bullish movement.
The current price behavior near key support shows significant absorption of supply. Order books reveal an unusual concentration of buy orders in this zone, suggesting that large holders are positioning themselves to defend this level. A reputable analyst under the pseudonym Chandler Charts has drawn a fascinating parallel with September 2023, when PEPE displayed similar readings of extreme overselling on the daily RSI indicator.
At that time, pessimism reigned supreme and few anticipated a reversal. Sentiment was so negative that many traders had taken massive short positions. This created perfect fuel for a short squeeze. What followed surprised even the most convinced bulls – a V-shaped rally of more than 100% in just a few weeks, propelling PEPE toward new all-time highs and massively liquidating short sellers.
HTF Market Structure Remains Intact Despite Volatility
Here’s a crucial element often overlooked by traders focused on the short term. PEPE maintains a bullish structure on higher timeframes. The analyst known as Bitcoin Maxi, who regularly trades memecoins, emphasized that despite the violence of the recent correction, the underlying trend remains upward-oriented. The memecoin is currently testing a key Fibonacci retracement level, commonly called “Flag 6” in his methodology.
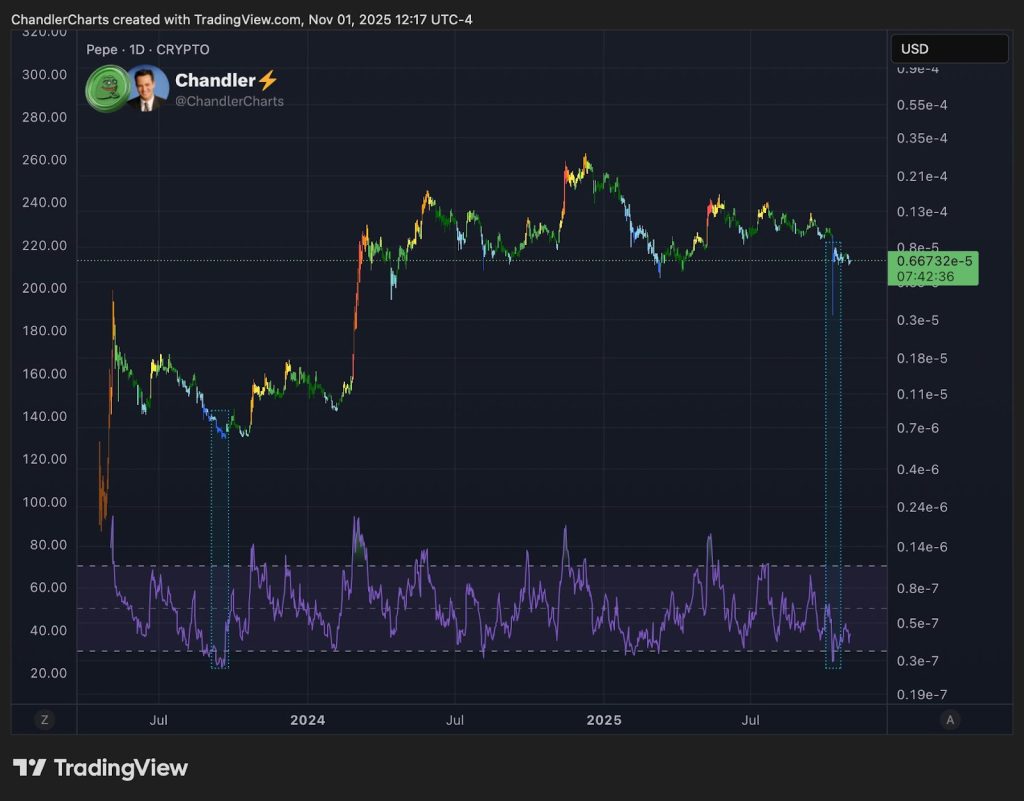
This technical configuration suggests that the current correction is merely a breathing pause in a larger bullish trend. The ascending highs and lows on the weekly chart confirm this reading. A return above $0.0000100 would definitively validate the scenario of a breakout zone retest, transforming the former resistance into new support. This zone would then become a strategic entry point for investors looking to position themselves before a potential acceleration toward the 2024 highs.
Resistance levels to watch are around $0.0000262, corresponding to previous peaks, with a possible extension toward $0.0000300 in case of sustained momentum. The risk/reward ratio becomes particularly attractive from current levels, with asymmetric gain potential if history were to repeat itself. Stop-losses can be positioned tightly below the current support, limiting downside risk while maintaining full exposure to a potential bullish explosion.
What Are Savvy Investors Watching Right Now?
Beyond pure technical analysis, several fundamental factors deserve attention. On-chain volume shows increased activity from large whales in this price zone, often a precursor signal of significant movements. Santiment data reveals that addresses holding between $1 and $10 million in PEPE have increased their positions by 8% over the past seven days, despite falling prices. This silent accumulation contrasts with retail sentiment, which remains largely negative.
The macroeconomic context will also play a decisive role. The correlation between PEPE and Bitcoin remains high, around 0.75, meaning that any significant BTC rebound will mechanically pull PEPE in its wake. The coming weeks will be crucial in determining whether the crypto market as a whole has found a floor or if additional downside awaits investors. Sentiment indicators, currently in extreme fear territory, paradoxically suggest that downside risk is limited in the short term.
Related topics:

