

Is Polkadot Really Validating a Bullish Breakout?
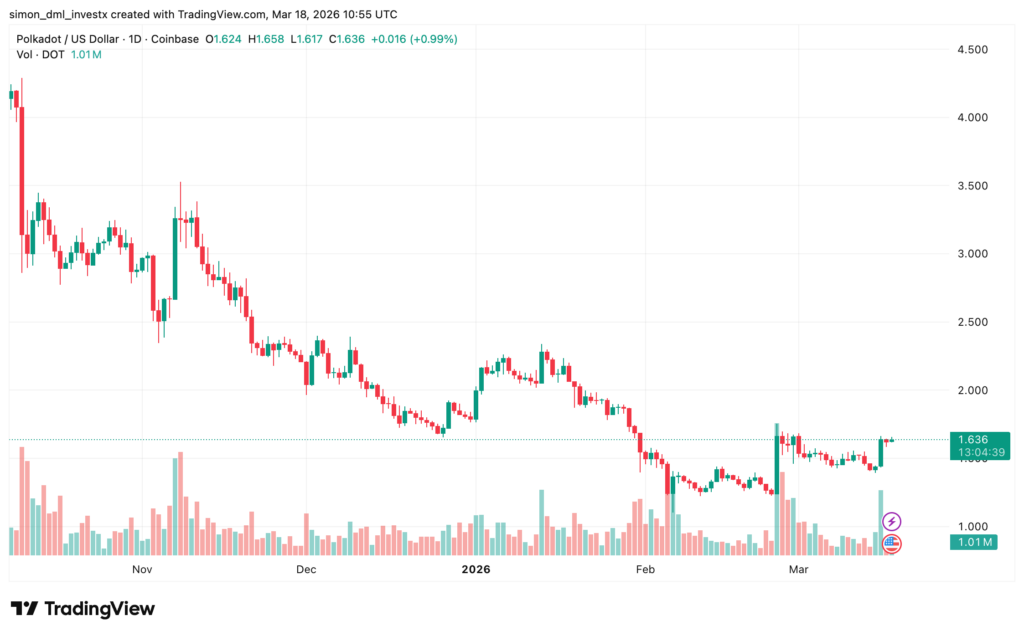
The technical analysis of Polkadot (DOT) highlights a potentially explosive configuration. The recent test of the $1.60 resistance has released buying pressure that has been building for several weeks. A confirmed close above this key level would strongly reinforce the scenario of a bullish reversal, with indicators like the RSI and MACD ready to support this momentum.
However, some caution remains warranted. A technical retracement toward this former resistance, now transformed into support, would be classic market behavior. This type of movement would allow for consolidation of the bullish structure and avoid excessive short-term volatility.
A clear bounce from this $1.60 zone would constitute a strong signal validating the breakout. In this case, investors could consider this phase as an accumulation opportunity, gradually strengthening their positions before a potential bullish continuation.
How High Can DOT Rise if Confirmed?
In an optimistic scenario, if momentum is maintained and trading volumes accompany the movement, DOT could quickly target higher levels. Buyers are already beginning to anticipate an extension toward $2, driven by a possible capital rotation toward altcoins in a globally more favorable market.
However, the risk of a false breakout should not be ignored. If the price fails to maintain the $1.60 threshold and drops back below, this could invalidate the bullish signal and trigger a wave of selling. This scenario would likely lead to a return toward lower supports, weakening the current structure.
In this context, the market remains at a pivotal point. The central question for investors is now whether this phase represents strategic accumulation before a rally… or simply a temporary bounce before a new correction phase.
Don’t miss out on your bonuses: Sign up on OKX and boost your trading!
Related Articles:

