

SAND : A Major Bullish Signal Forming ?
The Sandbox (SAND) is currently at a critical point in its evolution. It shows encouraging signals of a potential trend reversal. The formation of a double bottom, a classic bullish chart pattern, suggests that the previous bearish phase might be coming to an end. If the price manages to break and maintain above the resistance level of $0.42, this could trigger a rapid acceleration towards the $0.60 zone.
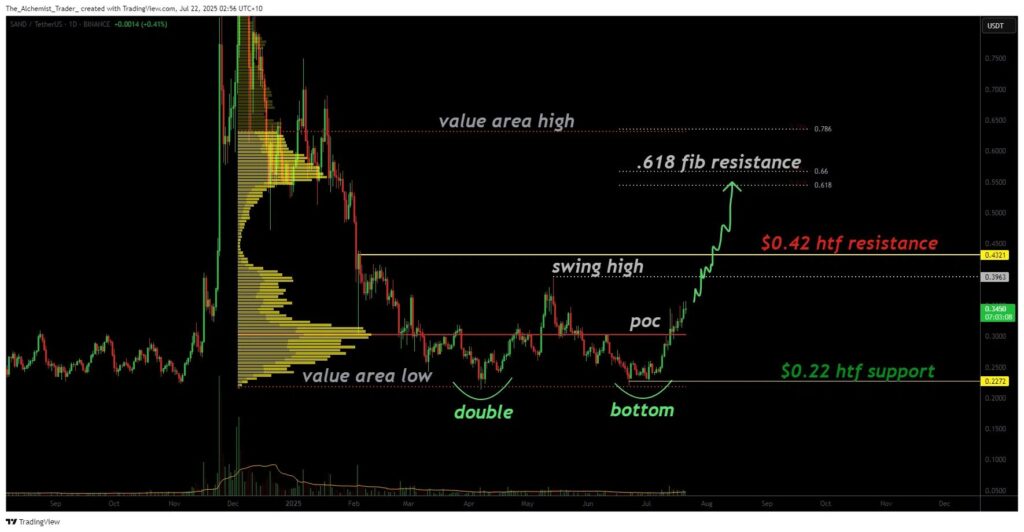
The technical analysis highlights the formation of a double bottom configuration on Sandbox, a chart pattern often observed at the end of a bearish trend. This structure is forming near the long-term support located at $0.22. It has the potential to mark a major market reversal. If this formation fully materializes, it will invalidate the previous bearish structure. It will also reinforce a change in dynamics in favor of a bullish continuation.
The $0.42 Level : A Wall or a Springboard ?
The Sandbox price has recently reclaimed the point of control, a zone representing the highest transaction volume and now playing a role as solid support. After several candle closures above this level, buyers seem to have regained ground.
The next major obstacle is at $0.42. A clear and sustainable breakout above this resistance could pave the way for a rapid expansion. We would be heading toward the 0.618 Fibonacci retracement level, or approximately $0.60. This breakthrough would be a strong signal of a significant change in market structure, heralding new upside opportunities.
Bullish Outlook for Sandbox ?
As long as Sandbox maintains higher lows and stays above the point of control, the bullish double bottom configuration remains valid. Reclaiming the key resistance at $0.42 would be an important catalyst, allowing for an accelerated progression toward $0.60. This zone, reinforced by a Fibonacci level, should then constitute the next major resistance area if buyers maintain the advantage.
Volume will be a determining factor to confirm the strength of this bullish momentum. A sustained or increasing influx of buying volumes would be an encouraging signal, validating the double bottom formation and ensuring the maintenance of buying pressure beyond resistance levels.

