

Solana Registers a Bullish Channel According to Bollinger Bands
Currently, the lower support of the Bollinger Bands for Solana is around $133, while the middle band, often equated to the simple 20-day moving average, hovers around $145. This technical setup suggests that SOL has just crossed its middle band, a bullish signal frequently interpreted by crypto traders.
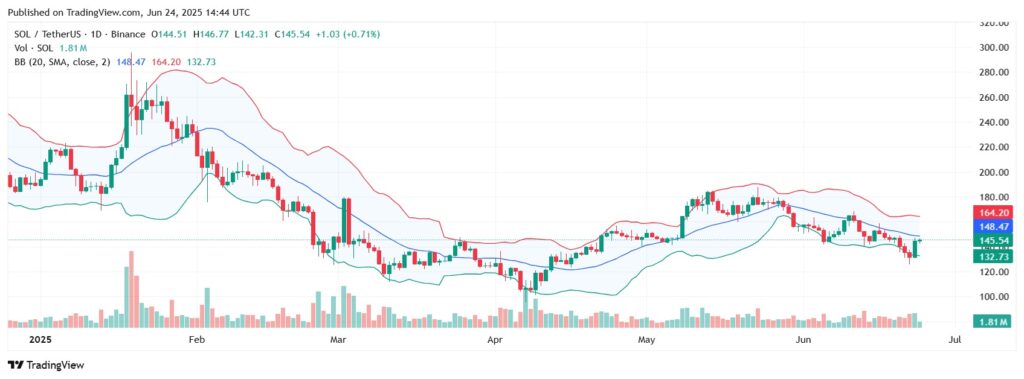
If the asset manages to hold its support around $145, a breakthrough towards the upper band – currently positioned around $164 – becomes an increasingly likely scenario. However, the resistance formed by the middle band at $145 is currently limiting the bullish momentum.
Volume Increase Accompanies the Rebound
Generally, a significant increase in volumes on Solana anticipates a continuation of the price uptrend. During the previous surge with a +92% volume, combined with an 8% price rise, a significant bullish movement was validated. Today, the momentum appears similar, reinforcing the credibility of the bullish scenario towards $164.
Additionally, forecasts from predictive markets estimate a 76% chance of an Solana ETF approval in July. This outlook could play a significant psychological role, especially among institutional investors.
The technical analysis of Solana shows a favorable setup for a breakout towards $164. Supported by increased volumes and optimism surrounding a potential Solana ETF, the token could consolidate its recovery in the coming days. However, investors will remain attentive to key support and resistance levels to validate a true bullish phase.

