Understanding the Decline in the Crypto Market Today: Key Factors Explained
The crypto market takes a breather after days of consecutive gains. Total market cap drops by $7 billion as Bitcoin struggles to break the psychological resistance at $115,000. Traders monitor support levels amid regulatory uncertainties to predict the market's next move.
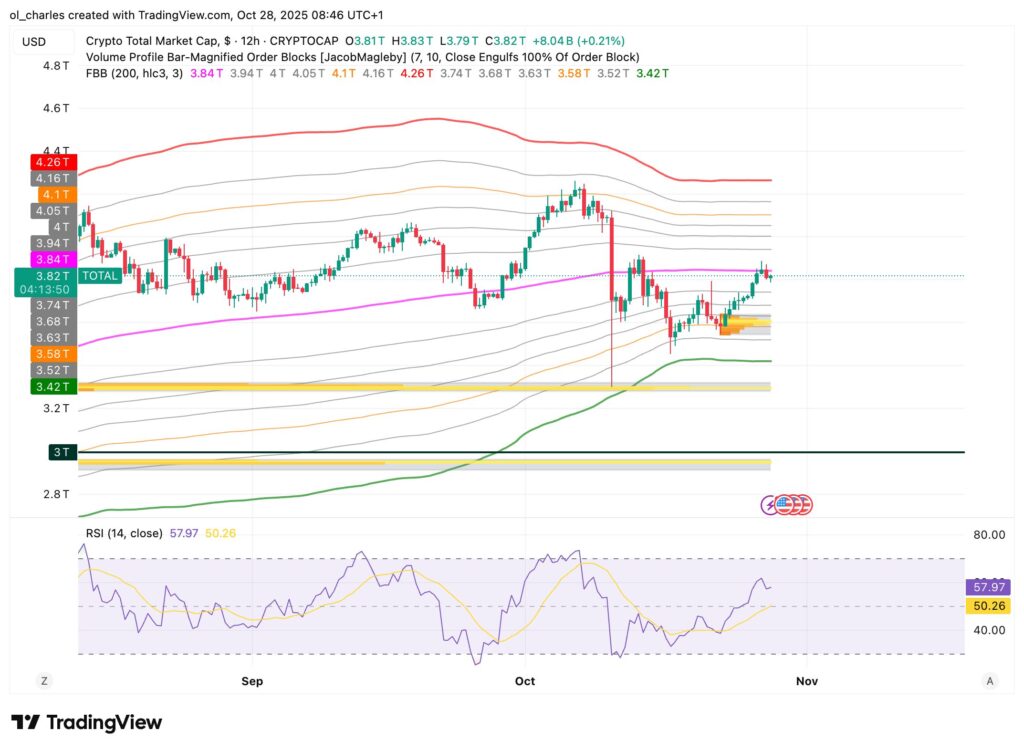
The total crypto market capitalization currently stands at $3.81 trillion, marking a decline of $7 billion in 24 hours. This pullback comes after an intraday peak of $3.89 trillion, reflecting a natural consolidation phase following the recent uptrend. Trading volumes remain robust, but velocity is decreasing, indicating that investors are adopting a wait-and-see approach amid the current volatility.
The support level at $3.81 trillion represents a critical zone for TOTAL. As long as this technical base holds, the bullish scenario remains valid, and a recovery toward $3.89 trillion remains feasible in the short term. However, a bearish breakdown would expose the market to a test of $3.73 trillion, a level corresponding to a major historical demand zone.
The relative strength indicator suggests a market in equilibrium, neither overbought nor oversold. This technical neutrality leaves the door open to both scenarios, making observation of upcoming sessions crucial for confirming the trend.
Bitcoin Stuck Below the $115,000 Barrier
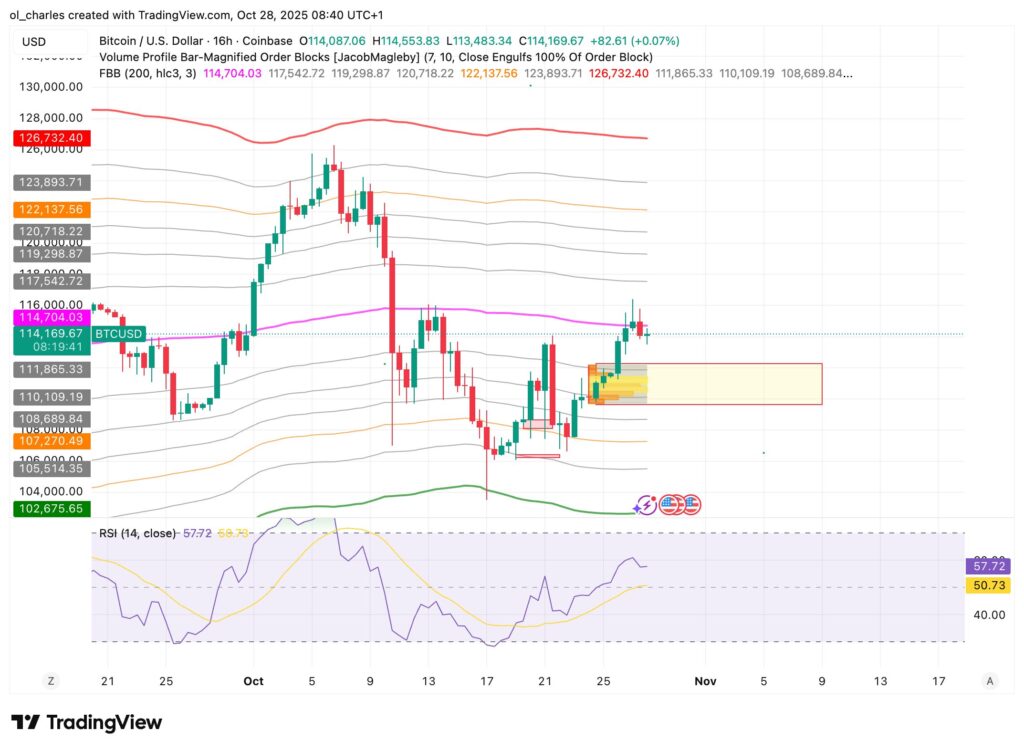
The BTC is currently trading at $114,090 after touching $113,400, hitting the $115,000 resistance level for the umpteenth time. This price zone has acted as a glass ceiling for several days, with successive rejections indicating organized selling pressure at this level. Long-term holders appear to be using this zone to reduce their positions, creating a temporary imbalance between supply and demand.
Immediate support levels are located between $112,500 and $109,600, corresponding to an order block on the 16H timeframe. A pullback to these zones would constitute a healthy technical correction and an opportunity to accumulate before a potential rebound, allowing for the absorption of speculative excess. The RSI remains in positive territory, oscillating around 60, indicating that the bullish momentum isn’t broken despite the current stagnation.
If Bitcoin manages to break through the $115,000 resistance with convincing volume, the next target sits at $117,261. This narrow range technical configuration typically precedes a strong directional movement, either upward or downward. Traders are closely watching momentum signals and volumes to anticipate the next impulse.
Regulatory Developments Weighing on Sentiment
The announcement of U.S. sanctions against Huione Group casts a shadow over the market. This Cambodian group is accused of laundering 15.9 billion Korean won (approximately $12 million) via exchange platforms using Tether. This news reminds us that the regulatory environment remains a major risk factor for the crypto ecosystem, particularly in Asia where authorities are intensifying their surveillance.
Paradoxically, the imminent launch of ETFs for Solana and HBAR by Bitwise and Canary Capital represents a positive signal for institutional adoption. These products mark a diversification of investment vehicles beyond Bitcoin and Ethereum. HBAR has already surged by 10% while SOL is preparing for a rally toward $220. This disconnect between positive fundamental developments and price action demonstrates a market dominated by short-term uncertainty.
MYX Finance perfectly illustrates this volatility with a 12% drop in 24 hours. The token is nevertheless defending its support at $2.64, a level tested multiple times. The Parabolic SAR indicator remains positively oriented, suggesting that a rebound toward $3.73 remains plausible if buyers regain control.
Altcoins are ready to explode ahead of tomorrow’s FOMC announcement. Buy your altcoins like HBAR, SOL, and MYX directly on Bitget. Take advantage of a $10 bonus offer for your first purchase:
Charles Ledoux is a Bitcoin and blockchain technology specialist. A graduate of the Crypto Academy, he has been a Bitcoin miner for over a year. He has written numerous masterclasses to educate newcomers to the industry and has authored over 2,000 articles on cryptocurrency. Now, he aims to share his passion for crypto through his articles for InvestX.
DISCLAIMER
This article is for informational purposes only and should not be considered as investment advice. Some of the partners featured on this site may not be regulated in your country. It is your responsibility to verify the compliance of these services with local regulations before using them.
DISCLAIMER
This article is for informational purposes only and should not be considered as investment advice. Trading cryptocurrencies involves risks, and it is important not to invest more than you can afford to lose.
InvestX is not responsible for the quality of the products or services presented on this page and cannot be held liable, directly or indirectly, for any damage or loss caused by the use of any product or service featured in this article. Investments in crypto assets are inherently risky; readers should conduct their own research before taking any action and invest only within their financial means. This article does not constitute investment advice.
Risk Warning : Trading financial instruments and/or cryptocurrencies carries a high level of risk, including the possibility of losing all or part of your investment. It may not be suitable for all investors. Cryptocurrency prices are highly volatile and can be influenced by external factors such as financial, regulatory, or political events. Margin trading increases financial risks.
CFDs (Contracts for Difference) are complex instruments with a high risk of rapid capital loss due to leverage. Between 74% and 89% of retail investor accounts lose money when trading CFDs. You should assess whether you understand how CFDs work and whether you can afford to take the high risk of losing your money.
Before engaging in financial or cryptocurrency trading, you must be fully informed about the associated risks and fees, carefully evaluate your investment objectives, level of experience, and risk tolerance, and seek professional advice if needed. InvestX.fr and the InvestX application may provide general market commentary, which does not constitute investment advice and should not be interpreted as such. Please consult an independent financial advisor for any investment-related questions. InvestX.fr disclaims any liability for errors, misinvestments, inaccuracies, or omissions and does not guarantee the accuracy or completeness of the information, texts, graphics, links, or other materials provided.
Some of the partners featured on this site may not be regulated in your country. It is your responsibility to verify the compliance of these services with local regulations before using them.
Get 6200 USDT with Bitget ! 🔥
Don't miss out on this offer !
Create your account now to unlock this exclusive reward