

Bitcoin Breaks Through Multiple Support Levels
Bitcoin has crossed the red line by losing the critical support level of $85,000, a technical level fiercely defended for several weeks. The breakdown triggered a cascade of automatic liquidations, briefly sending BTC into the $81,000 zone before a slight technical bounce. This drop of more than 12% in just a few days marks one of the most violent weekly corrections of the current cycle.
The entire crypto ecosystem is now experiencing intense bearish pressure. Altcoins are suffering even more severe losses, with declines reaching 20 to 30% for some major tokens. Liquidity is evaporating rapidly as fear sets in among retail holders, pushing many of them to capitulation. On-chain analysts clearly identify a wave of panic selling from short-term holders, those investors who bought recently and are now realizing substantial losses.
This bearish dynamic is accompanied by a particularly worrying technical signal: the Coinbase premium has remained negative for 21 consecutive days, establishing the longest bearish streak of this cycle. This metric compares Bitcoin’s price on Coinbase to global exchanges, revealing the sentiment of American investors, traditionally considered solid institutional buyers.
The Negative Coinbase Premium: What Does This Record 21-Day Streak Reveal?
The Coinbase premium represents one of the most reliable sentiment indicators in the crypto market. When it turns negative, it means that American traders are selling more aggressively than their international counterparts, accepting lower prices to exit their positions. A sporadic negative reading is not alarming, but 21 consecutive days of negative premium constitute an exceptional signal reflecting deep capitulation on the American side.
Historically, similar periods have coincided with major corrections or the end of bull cycles. In 2022, a prolonged negative streak preceded the FTX collapse and the drop below $20,000. However, during the 2019-2020 cycle, extended negative readings also marked absolute bottoms before powerful recoveries. The current macro context therefore plays a determining role in interpreting this data.
This persistent selling pressure reflects several dynamics: loss realization by short-term holders, institutional caution in the face of macroeconomic uncertainty, and possibly exits related to tax or regulatory issues in the United States. As long as this premium remains deeply negative, the probability of a sustained rebound remains limited. A reversal of this metric into positive territory would constitute the first signal of a sentiment change.
Technical Analysis: The Weekly Chart Confirms the Structural Break
Bitcoin’s weekly timeframe reveals a major technical breakdown that invalidates the bullish structure maintained for a year. The latest weekly candle shows a drop of more than 12%, accompanied by significantly above-average selling volume. This configuration suggests massive distribution rather than a simple temporary technical correction.
BTC has lost the 50-week exponential moving average, a dynamic support that had perfectly contained corrections since early 2024. The next critical defense zone lies around the 100-week moving average, currently near $80,000. A weekly close below this level would open the way to testing the 200-week MA, historically considered the last bastion before a prolonged bearish phase.
Momentum indicators confirm the technical deterioration: the weekly RSI has dropped below 40 for the first time in 18 months, while the MACD has just executed a bearish crossover. These signals suggest that selling pressure could persist for several weeks before stabilization. To invalidate this bearish scenario, Bitcoin would need to quickly reclaim $90,000 with convincing buying volume.
Short-Term Holder Capitulation: Opportunity or Trap for Bitcoin?
On-chain data shows that short-term holders are currently experiencing significant losses, with a record percentage of positions in loss since the March ATH. This category of investors, defined as having acquired their BTC less than 155 days ago, traditionally represents the weak hands of the market. Their massive capitulation often creates accumulation opportunities for long-term investors.
However, it is crucial to distinguish between mid-cycle capitulation, which generally precedes a rapid recovery, and end-of-cycle capitulation, which marks the beginning of a prolonged bear market. Previous cycles show that true bottoms form when even long-term holders begin to sell, which is not yet the case according to current metrics. Experienced HODLers continue to accumulate, suggesting conviction that the bull cycle is not over.
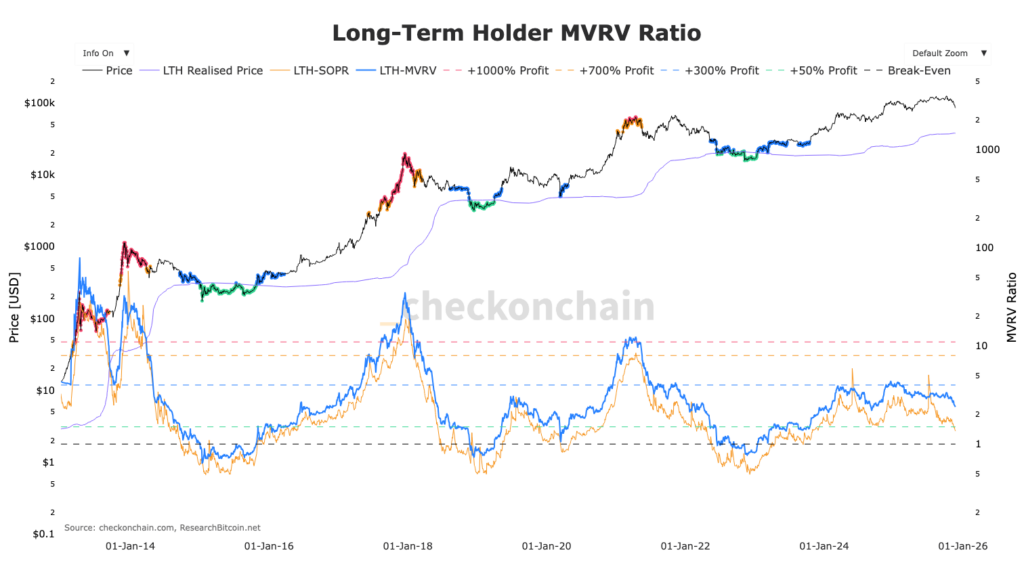
The short-term holders’ MVRV ratio has fallen into deeply negative territory, a zone that has historically marked strategic accumulation points. Nevertheless, in an uncertain macro context with interest rates still elevated and crypto regulation tightening, caution remains warranted. Savvy traders are waiting for clear stabilization signals before repositioning massively.
What to Do in the Face of This Brutal Correction?
Faced with this extreme volatility, several strategies are available to crypto investors depending on their risk profile.
For medium and long-term investors, this capitulation phase could represent a progressive accumulation opportunity via a DCA (Dollar Cost Averaging) strategy. In this context, the DCA Bot from Pionex is ideal because it automates and optimizes your DCA.
The Hedging bot is also recommended because it offers a market-neutral strategy and protects against prolonged drops. Test the bots for free in a few clicks and try to win a 1000 USDT bonus on top:
Related articles:

