

The Historical Pattern Predicting a Massive XRP Rally
Crypto analyst Mikybull has shared a chart highlighting a recurring price structure in XRP ‘s history since 2014. This configuration breaks down into three distinct phases: accumulation forming a rounded bottom, a clean break of the long-term bearish trend, followed by a lateral consolidation phase before the bullish explosion.
This pattern manifested between 2014 and 2017, a period that culminated with XRP’s historic rally during the 2017 bull market. The asset had reached all-time highs after a prolonged accumulation phase. Today, the same pattern is repeating on a larger time scale. After nearly five years of construction between 2018 and 2023, XRP finally broke its major long-term resistance, creating a technical structure similar to the one that preceded its previous significant rally.
The current consolidation zone, marked in orange on Mikybull’s chart, represents what traders call a re-accumulation phase. This critical stage absorbs residual selling pressure before the market resumes its upward momentum. The parallel with ZCASH becomes evident: before its 40x rally, this cryptocurrency had gone through exactly the same post-breakout consolidation sequence.
Price Targets Between $8 and $30 Divide Analysts
Mikybull targets a conservative range of $8 to $10 for XRP, which corresponds to a four to five-fold multiplication from current levels. This projection is based on Fibonacci retracement levels and historical resistances dating back to the 2018 peak. These price zones represent solid technical targets, supported by classic chart analysis.
However, XForceGlobal, another recognized analyst in the crypto community, adopts a much more aggressive view. He maintains his cycle targets between $15 and $30 per XRP, suggesting that the bullish potential could far exceed Mikybull’s moderate forecasts. This divergence in projections reflects two different approaches: one cautious and progressive, the other anticipating a rally in multiple waves of increasing magnitude.
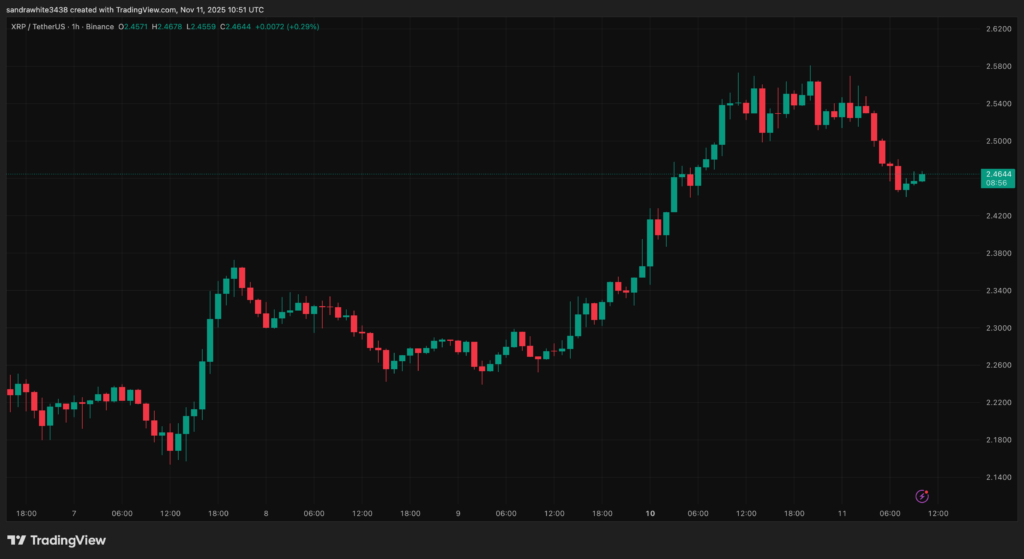
The current support around $2 proves critical in this configuration. As long as XRP maintains this level and continues its lateral consolidation, the probability of a parabolic move remains high. Trading volume and market sentiment must confirm the break of this re-accumulation zone to definitively validate the bullish scenario. Traders are particularly watching the immediate resistance around $2.50 as the first signal of trend resumption.
Macroeconomic Context Reinforces the Bullish Scenario
Beyond pure technical analysis, several fundamental factors support the scenario of a major XRP rally. Favorable legal developments in the lawsuit between Ripple and the SEC have significantly improved market sentiment around this asset. This progressive regulatory clarity attracts institutional investors who previously avoided XRP due to legal caution.
The global crypto market dynamics also play a determining role. If Bitcoin and Ethereum maintain their bullish trend, major altcoins like XRP generally benefit from a trickle-down effect that amplifies their movements. The current cycle could see XRP capture a significant share of capital flows seeking returns superior to those of first-generation cryptocurrencies.
The comparison with ZCASH remains relevant as both assets share certain characteristics: a long accumulation period followed by a major technical breakout in a globally bullish market context. However, XRP possesses a structural advantage with its significantly higher market cap and liquidity, which could paradoxically facilitate a sustained rally without the violent corrections that marked ZCASH’s ascension.
Related Articles:

