

Kaspa Surges 37%: The Crypto About to Explode?
Kaspa (KAS) is recording today one of the most remarkable performances in the top 50 crypto rankings with a surge of 37% that propels the price to $0.061. This explosion is primarily driven by aggressive accumulation activity from whale wallets.
The largest KAS holder has added more than 10 million tokens in a single day, bringing their total holdings beyond 1.2 billion tokens. This position now represents approximately 4 to 5% of the circulating supply, mechanically creating massive buying pressure on a low liquidity market.
Kaspa’s supply structure reveals critical data: nearly half of the total supply has remained inactive for over six months. This concentration in the hands of long term holders, combined with limited liquidity on the sell side across exchanges, explains why even moderate buying volumes generate such violent price movements.
Beware, however, of the structural volatility of this asset. Kaspa’s history shows a 70% crash from its 2024 ATH, reminding traders that these price explosions can reverse just as quickly. Traders must monitor resistance levels and volume evolution to confirm the strength of this breakout.
Kaspa is now available on Ledger. Accumulate your KAS securely right now and take advantage of our 50% discount or $90 in BTC offered for the purchase of a Ledger wallet of your choice:

SPX6900 Climbs 18.88%: Memecoin Fever Defies the Correction
While the broader market undergoes a consolidation phase, SPX6900 ($SPX) displays an impressive counter-trend performance with a gain of 18.88% over the last 24 hours. The price has decisively broken through resistance at $0.60, a key technical level monitored by traders.
The memecoin sector displays a market cap of $42 billion and is currently capturing significant inflows, creating notable sector rotation. Technical indicators support this dynamic: the MACD shows a bullish crossover while the RSI confirms buying momentum without yet being in overbought territory.
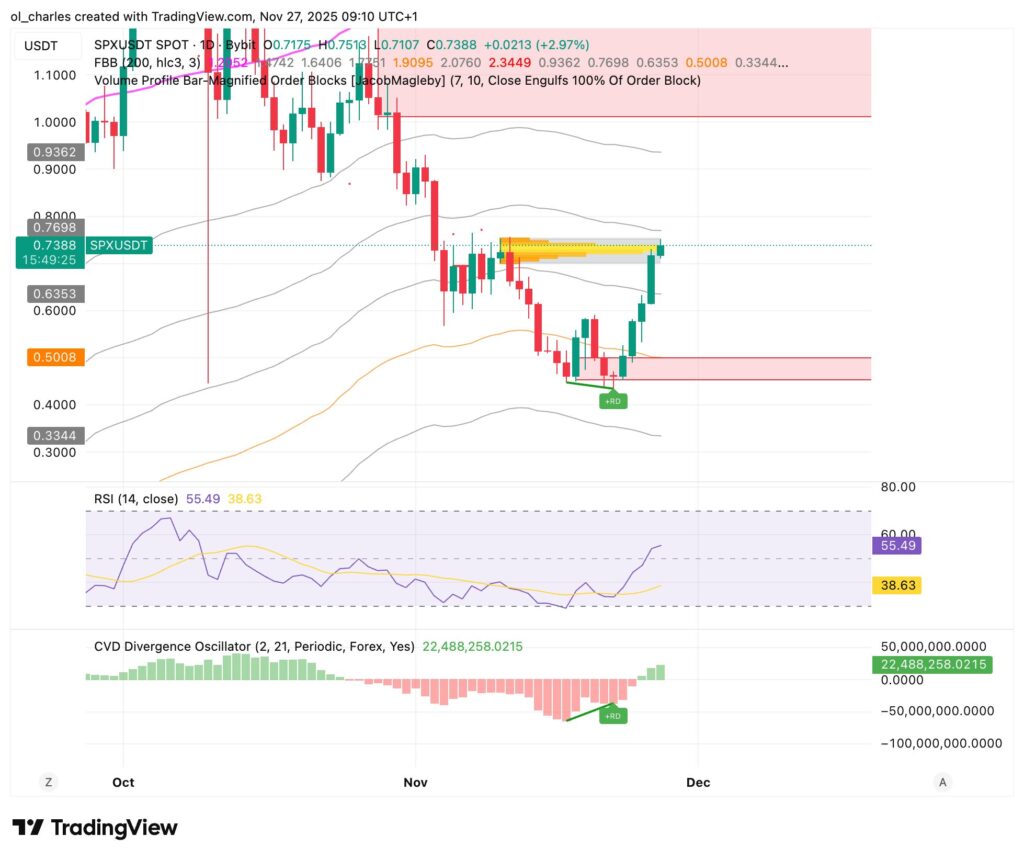
On-chain activity reveals growth in active holders across Base and other chains, suggesting a broadening investor base rather than mere concentrated speculation. The crucial test now lies around maintaining above $0.60. In case of retracement, support zones are located between $0.52 and $0.48, but the low liquidity at these levels could amplify any potential correction if traders begin taking profits.
Bitcoin Targets $90,000: Between Technical Optimism and Structural Caution
Bitcoin is flirting with the psychological level of $92,000, but technical analysis reveals that momentum still lacks conviction to confirm a genuine bullish reversal. The market remains in a high risk environment according to sentiment indicators.
To validate a structural regime change, Bitcoin must accomplish several successive steps. First, establish its first daily close inside the $89,000 to $90,000 zone, then consolidate this level before targeting the extension toward $91,500. The real breakout will then require breaking through the compression band located between $93,500 and $95,000.
The Risk Signal is the decisive indicator to monitor. As long as it remains in high risk regime, every upward move should be interpreted as tactical rather than structural.

The 3-day FBB shows a midline at $91,400. As long as BTC does not maintain above this level, the risks of sharp drops remain present.
Related articles:

