Why Solana (SOL) Could Skyrocket in October
The crypto market is facing pressure once again. What about Solana (SOL), one of the most high-performing blockchains? Our technical analysis deciphers the current challenges and prospects for investors.


The crypto market is facing pressure once again. What about Solana (SOL), one of the most high-performing blockchains? Our technical analysis deciphers the current challenges and prospects for investors.
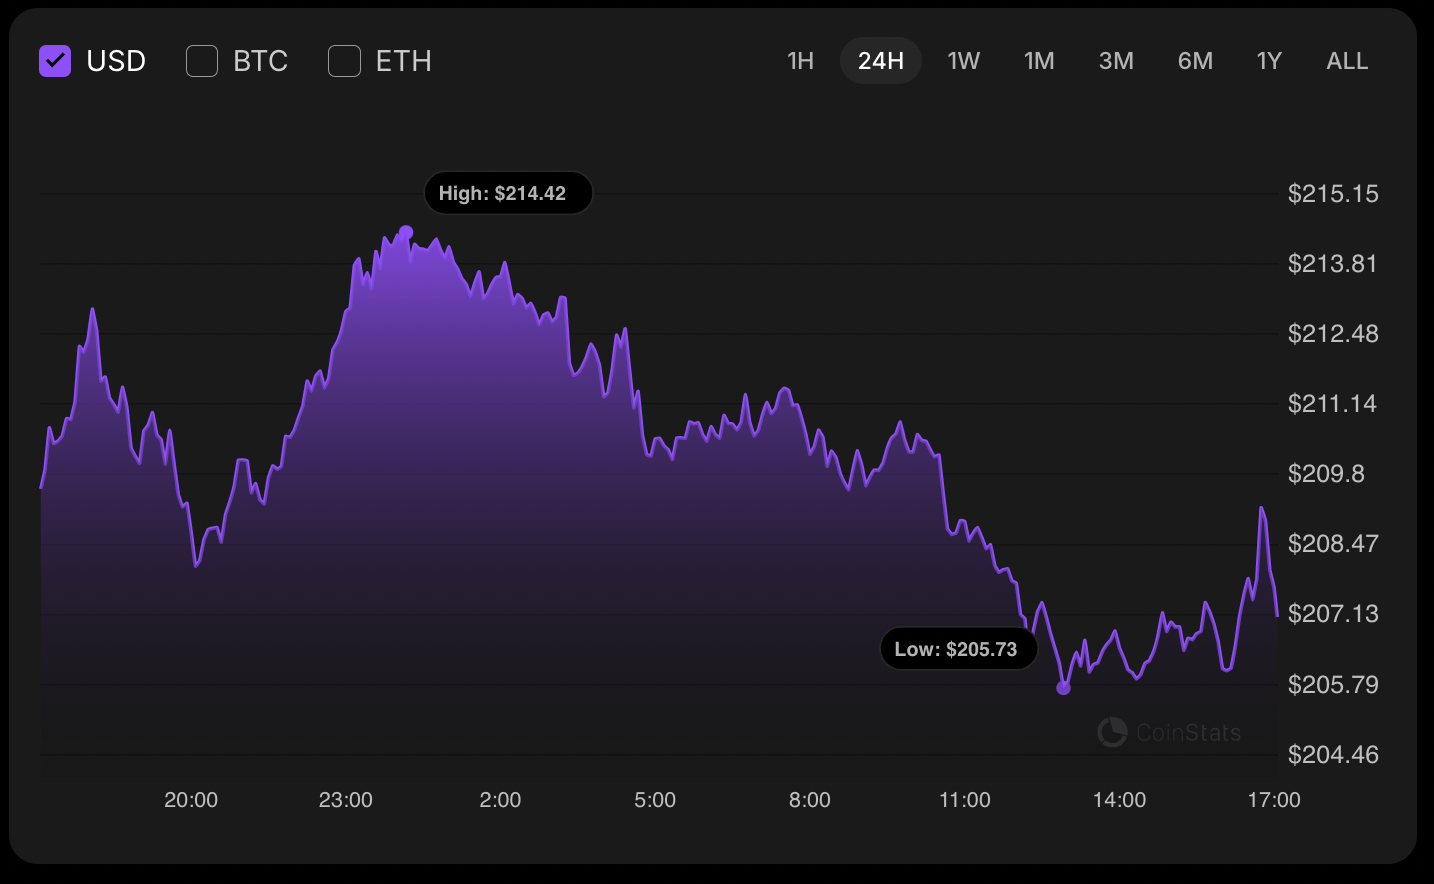
Over the last 24 hours, the Solana (SOL) token has recorded a 1.11% drop, aligning with a broader market downturn amid high volatility. At the time of analysis, SOL is trading around $206.70, having failed to sustainably break through the $215 resistance zone.
Technical signals show a weakening buying pressure across both short and long timeframes. This dynamic undermines the position of investors and traders with SOL positions.
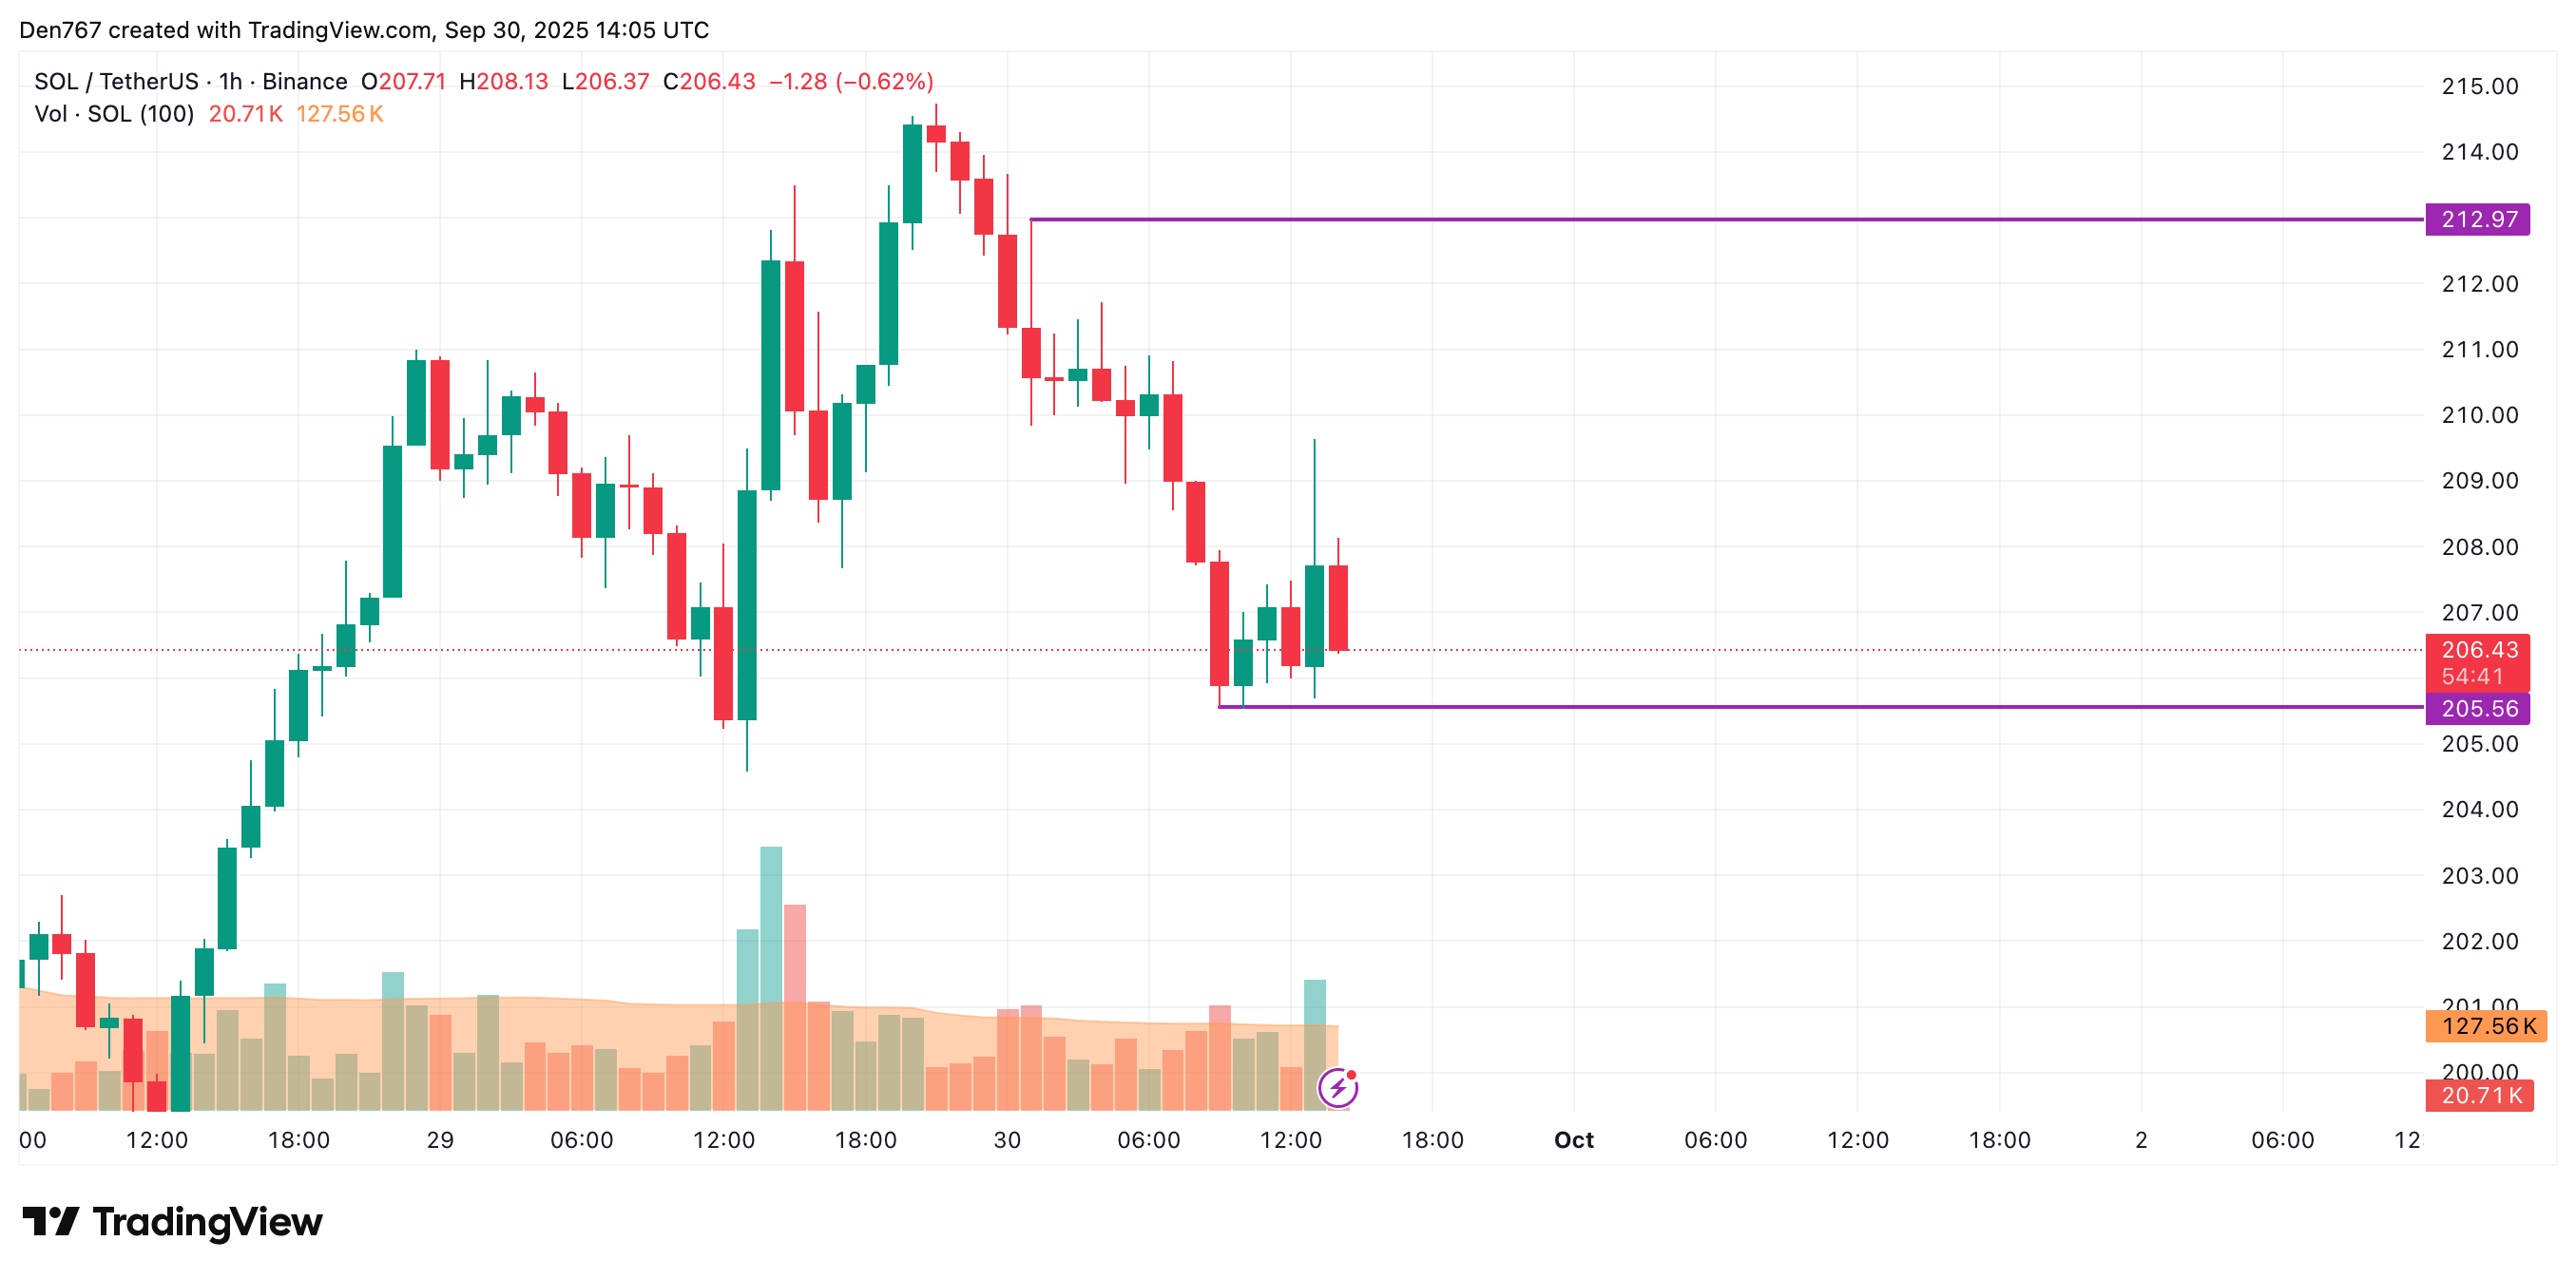
On the H1 chart (one hour), SOL’s price is approaching a technical support threshold at $205.56. If this level breaks, sellers could quickly drive the price toward the next critical zone at $204, representing a confluence of short-term supports.
This zone constitutes a key point of interest for scalpers and day traders looking for reversal or continuation signals.
On the daily timeframe, technical signals remain concerning. After an aborted bullish attempt, the current candle indicates a bearish consolidation that could be confirmed if the daily close falls below $206, reinforcing the scenario of a descent toward the psychological $200 zone.
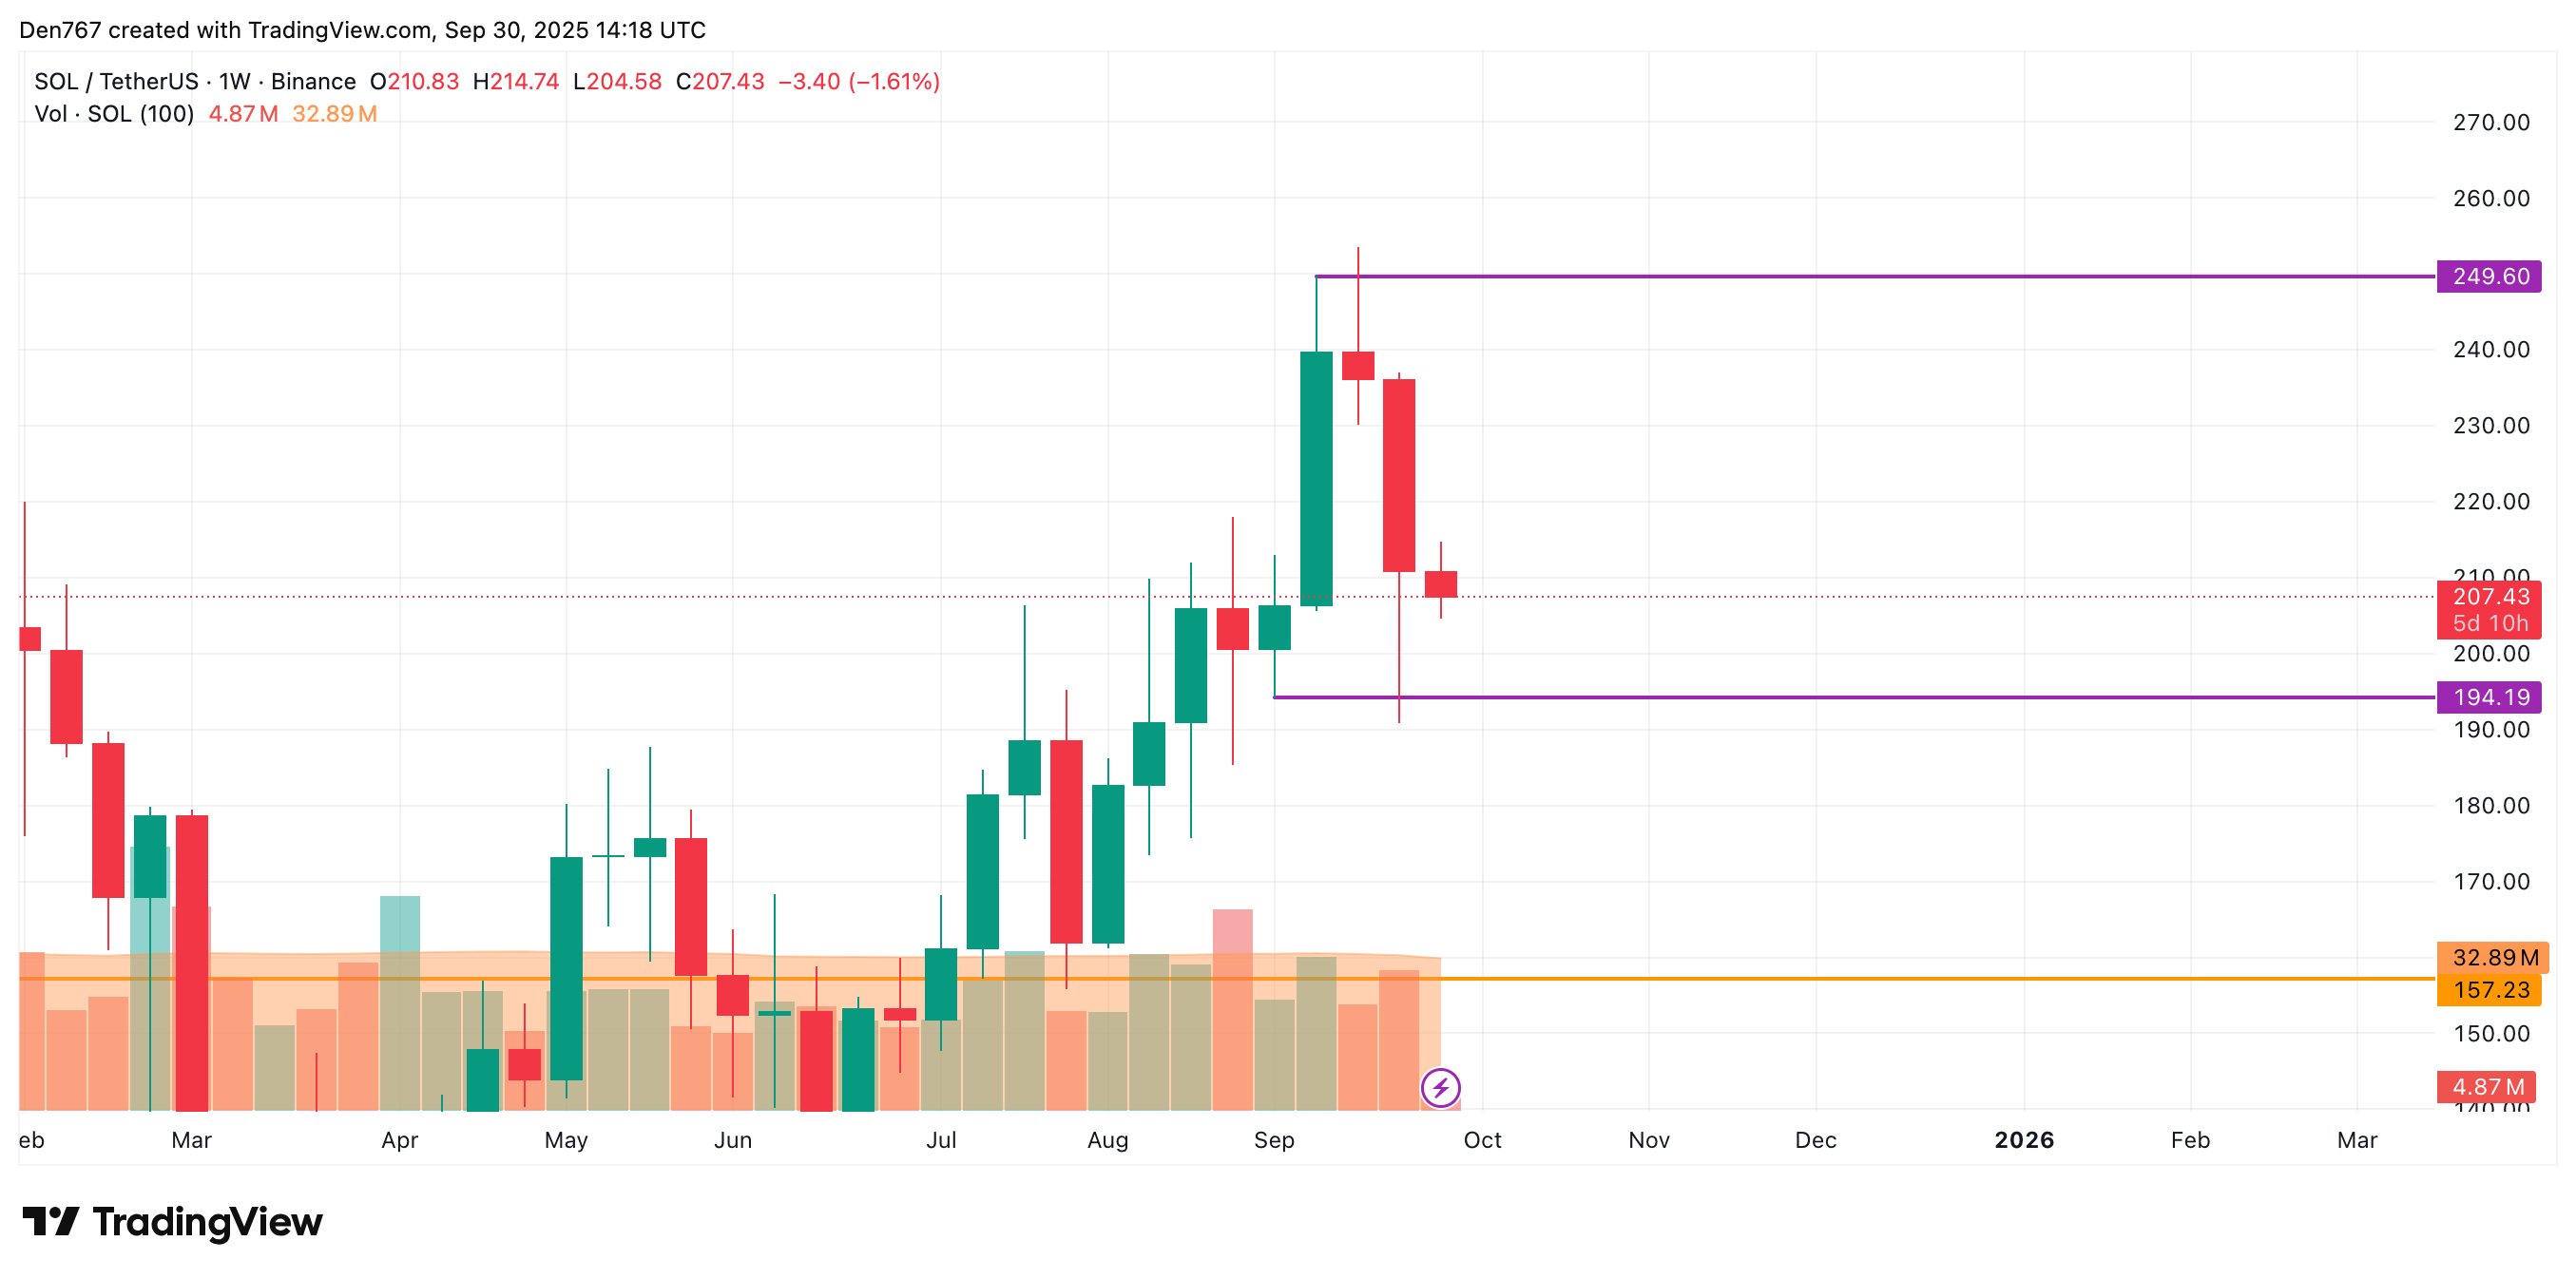
On the weekly chart, a key threshold sits around $194.19. If the September 30 close occurs in this zone, it would confirm a persistent structural weakness, paving the way for a possible return to the $180-200 range, identified as long-term support since summer 2025.
This downward momentum is accentuated by a loss of buying momentum on the MACD and RSI, a decrease in bullish volumes in the spot market, and growing dominance of short positions in futures markets.
For long-term investors (hodlers), the $180-200 zone could represent a strategic entry point, provided the global market (Bitcoin and Ethereum included) confirms a bullish recovery. However, caution remains essential given the uncertain macroeconomic and regulatory context.
For active traders, shorting opportunities emerge if there’s a confirmed break below $205.56 or $194. Intraday strategies based on RSI, moving averages, or Bollinger Bands are particularly relevant for capturing these rapid movements.
Overall, SOL’s technical analysis highlights persistent fragility. A close below the key thresholds would strengthen the probability of a pullback toward $200 or even $180, which could represent both a threat for exposed traders and an accumulation opportunity for patient investors in a solid Web3 project.
With Solana’s (SOL) current price around $200, don’t miss this potential entry point in the $180-200 zone, considered a key long-term support by many investors.
Here’s a buying guide for Bitget:
Related articles:

Passionate about cryptocurrencies since 2019, I cover the latest news through clear and accessible articles. My goal is to make crypto understandable for everyone, with reliable and well-researched content.
DISCLAIMER
This article is for informational purposes only and should not be considered as investment advice. Trading cryptocurrencies involves risks, and it is important not to invest more than you can afford to lose.
InvestX is not responsible for the quality of the products or services presented on this page and cannot be held liable, directly or indirectly, for any damage or loss caused by the use of any product or service featured in this article. Investments in crypto assets are inherently risky; readers should conduct their own research before taking any action and invest only within their financial means. This article does not constitute investment advice.


Risk Warning : Trading financial instruments and/or cryptocurrencies carries a high level of risk, including the possibility of losing all or part of your investment. It may not be suitable for all investors. Cryptocurrency prices are highly volatile and can be influenced by external factors such as financial, regulatory, or political events. Margin trading increases financial risks.
CFDs (Contracts for Difference) are complex instruments with a high risk of rapid capital loss due to leverage. Between 74% and 89% of retail investor accounts lose money when trading CFDs. You should assess whether you understand how CFDs work and whether you can afford to take the high risk of losing your money.
Before engaging in financial or cryptocurrency trading, you must be fully informed about the associated risks and fees, carefully evaluate your investment objectives, level of experience, and risk tolerance, and seek professional advice if needed. InvestX.fr and the InvestX application may provide general market commentary, which does not constitute investment advice and should not be interpreted as such. Please consult an independent financial advisor for any investment-related questions. InvestX.fr disclaims any liability for errors, misinvestments, inaccuracies, or omissions and does not guarantee the accuracy or completeness of the information, texts, graphics, links, or other materials provided.
Some of the partners featured on this site may not be regulated in your country. It is your responsibility to verify the compliance of these services with local regulations before using them.
