

The Expected Crypto Market Rebound
The cryptocurrency market is breathing again. Bitcoin and Ethereum are charting their course in the green, with ETH surging over 6% in the last 24 hours. This positive momentum is flowing throughout the altcoin and memecoin ecosystem. SPX6900 (SPX) is benefiting moderately from this renewed momentum, but it’s on the technical front that things are becoming truly interesting.
The daily chart of SPX reveals a structure that chartists find mouthwatering: a perfectly drawn inverted head and shoulders pattern. This pattern ranks among the most powerful bullish reversal signals recognized by technical analysis. The question is no longer whether SPX can perform, but rather when the breakout will occur.
A Technical Structure That Checks All the Boxes
The pattern has been methodically building over the weeks. The left shoulder formed in early November, followed by a more pronounced trough at $0.4344 constituting the head of the pattern. The bulls then regained the initiative, pushing the price up to $0.5830 to form the right shoulder, thus validating the structure with a higher high than the previous one.
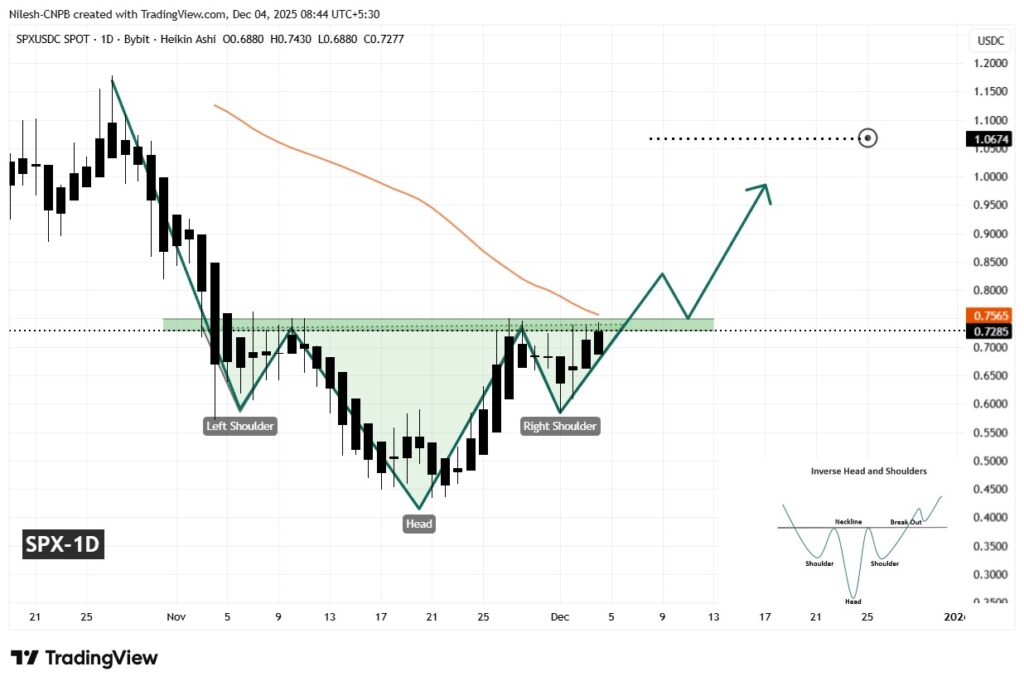
Since then, SPX has been gradually gaining ground and is currently testing the critical resistance zone located between $0.7275 and $0.7509. This price band corresponds to the neckline of the pattern, tested multiple times without success for over a month.
The repetition of these tests without a break shows that this zone concentrates significant selling pressure. But each new test generally weakens the resistance. A decisive breakout above $0.7509 with substantial volume would definitively validate the chart pattern and likely trigger a wave of technical buying.
An Ambitious but Realistic Price Target for SPX
The classic rules of technical analysis allow for calculating a price target for this type of configuration. The height of the pattern, measured from the head to the neckline, is then projected from the breakout point. For SPX6900, this gives a theoretical target around $1.0674, representing a potential upside of 46% from the breakout level.
This bullish scenario fits perfectly within the current context. Liquidity is gradually returning to the altcoin and memecoin segments, carried by Ethereum’s recovery. Capital flow is reorienting towards smaller market cap assets after several weeks of Bitcoin dominance.
The ideal scenario would involve a clean break above $0.7509, followed by a technical pullback to retest this former resistance turned support. This retest would constitute the strongest confirmation of a trend change and would offer a measured risk entry point for traders who might have missed the initial breakout.
Related articles:

