

Technical Patterns That Don’t Lie
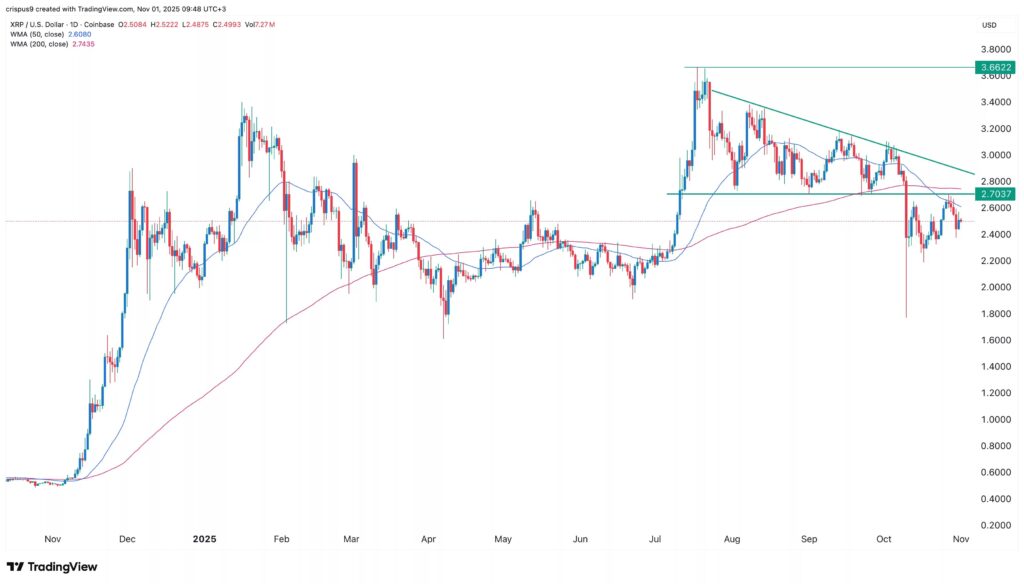
Analysis of XRP price reveals at least two unfavorable chart formations that signal a risk of short-term correction. Experienced traders recognize these technical patterns as major warning signals that shouldn’t be ignored in the current market context.
The first pattern corresponds to a classic distribution structure, where buying volumes progressively decrease while selling pressure intensifies. Resistance zones become veritable technical ceilings, creating a fragile environment for long positions.
The second technical pattern reinforces this perspective. The formation of a double top or descending wedge (depending on the timeframe) suggests a loss of bullish momentum. Momentum indicators like the RSI and MACD show negative divergence, confirming a progressive weakening of buying dynamics despite positive news related to XRP ETFs.
This configuration positions the $2 level as a key psychological and technical support. A break below this threshold could trigger a wave of liquidations and amplify the short-term downward movement.
The Paradoxical Effect of XRP ETF Arrival
While the market enthusiastically anticipates the launch of spot XRP ETFs, often perceived as a bullish catalyst, the technical fragility of the price reinforces uncertainty. This scenario perfectly illustrates the “buy the rumor, sell the news” principle, well-known among crypto investors.
Institutional investors and whales seem to be taking advantage of the pre-launch euphoria to lighten their positions and take anticipated profits. This strategy would explain the current selling pressure, despite an overall positive market sentiment.
The history of Bitcoin ETFs and Ethereum ETFs shows that volatility often intensifies before and after their implementation, creating accumulation opportunities for patient investors.
XRP’s trading volumes confirm this climate of uncertainty, with intraday volatility spikes reflecting a struggle between optimistic buyers and cautious sellers.
For active XRP traders, several key levels are worth monitoring:
- $2.00: First major psychological support.
- $1.80 – $1.90: Secondary support zones in case of a breakdown.
- $2.40 – $2.60: Crucial resistance to overcome to invalidate the bearish scenario.
A weekly close above $2.60 would be a strong signal of bullish recovery, supported by the arrival of XRP ETFs. Savvy traders are adapting their risk management strategies, with tight stop-losses and reduced exposure in this volatile context.
How to Buy XRP on Bitget?
Traders are watching XRP: A break above $2.60 could reverse everything!
Take advantage of the exclusive Bitget offer and get 10% cashback on your XRP purchase today.
Here’s how to buy XRP on Bitget:
- Create a Bitget account and verify your identity (KYC).
- Deposit funds (wire transfer, card, or crypto).
- Search for XRP in the “Market” section.
- Choose the amount to buy and confirm your transaction.
- (Optional) Transfer your XRP to a personal wallet for added security.

On the same topic:

