

A Fractal Resembling BNB’s Bull Run in 2018
Current chart analysis reveals that the current price structure of HYPE and its correction phase closely resemble BNB’s bull run in 2018. Both assets have formed an ascending wedge pattern, followed by a sharp decline into a key accumulation zone just above the 50-week moving average.
This pattern, combined with a bullish MACD crossover, eventually triggered a massive surge, pushing BNB’s price up by over 470%. Today, HYPE seems to be following the same path. After breaking down from a similar ascending wedge, it retested its support range of $12 to $16, the same range where BNB initiated its reversal.
Currently, HYPE is trading slightly above this range, at $16, and like BNB back then, it is nearing its 50-day moving average (at $20), which could act as a major trigger point for a bullish momentum.
Bullish Outlook for HYPE ?
If the fractal continues to play out, HYPE could be on the verge of a significant breakthrough to the upside. Once price action clearly surpasses the 50-day moving average, it could trigger a parabolic move towards the $30 to $45 range, echoing BNB’s meteoric rise post-reversal.
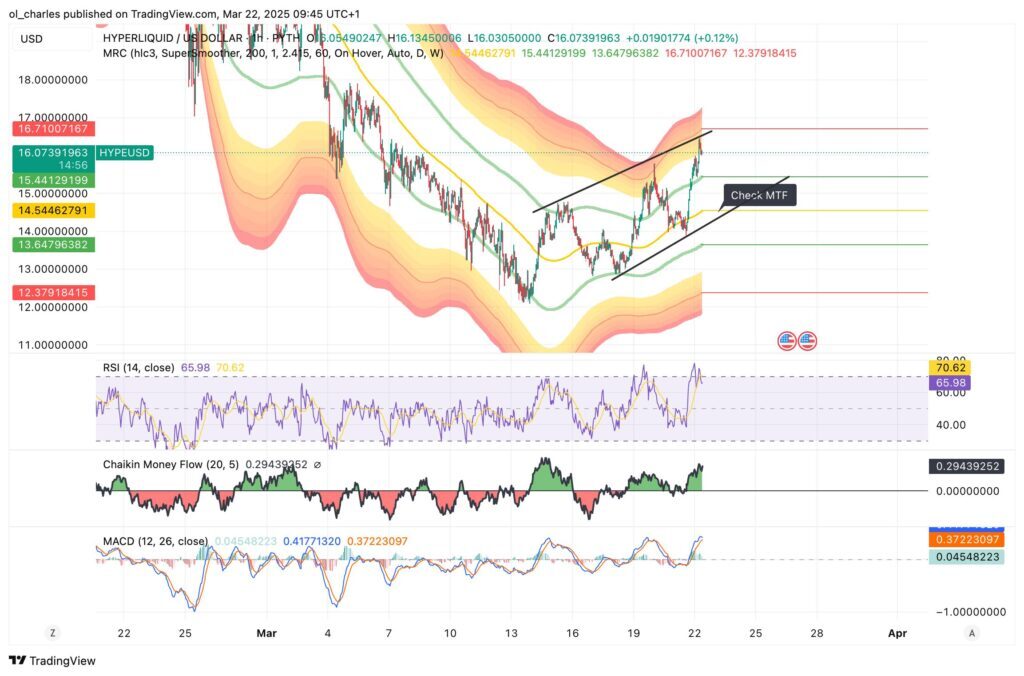
However, in the short term, on the 1 and 3-hour charts, a divergence in the RSI can be observed, which could lead to a retracement to $14.5. It also forms a bullish channel, with $14.5 marking the channel’s lower boundary.
Momentum indicators and market sentiment seem to be aligning for a strong move in the coming months. Of course, nothing is guaranteed, but fractals like this often play a crucial role in forecasting major movements, especially when combined with key technical indicators.
For now, as long as the key resistance at $26 remains unbroken, the medium to long-term trend remains bearish. On the other hand, in the short term, a break above $17 should take HYPE towards the range between $26 and $22. This represents a rise of 39 to 60%.

