

Is Ethereum’s Bullish Pattern Collapsing ?
After forming a classic “cup and handle” pattern, typically synonymous with a bullish continuation, Ethereum has failed to break through the $3,950 resistance. It’s now evolving within a descending channel.
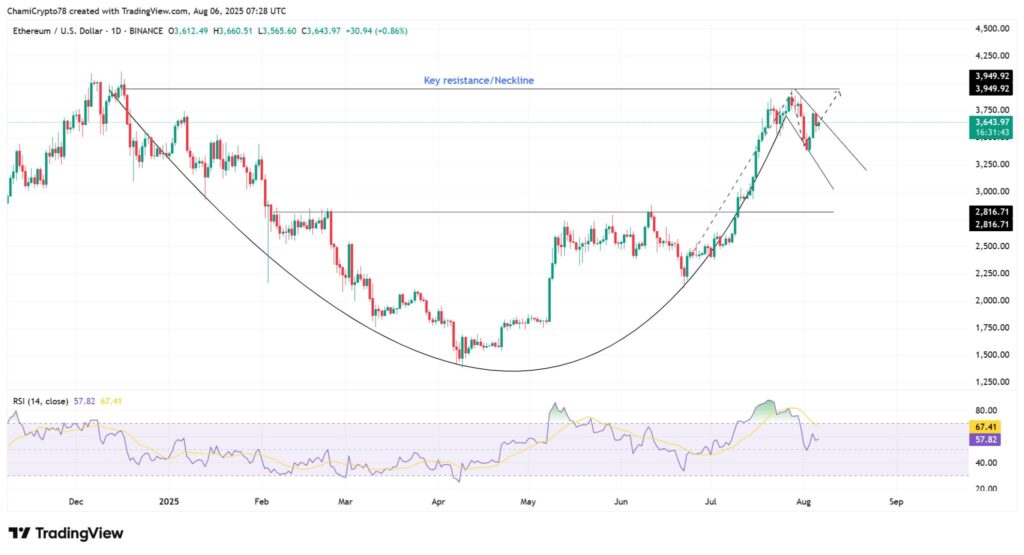
Key indicators :
- An RSI at 57, indicating neutral momentum without any clear breakout signal.
- The inability to breach key levels could invalidate the pattern, forcing buyers to quickly regain control.
- Ethereum must rapidly reclaim the $3,950 level to preserve its bullish structure and avoid a deeper pullback toward lower support levels.
On-Chain Growth Offsets Bearish Signals
Despite persistent selling pressure, Ethereum network activity is surging: +29.94% new addresses and +3.17% active addresses.

Key takeaways :
- Continuous address growth can provide a solid foundation for price stabilization and rebound.
- This divergence between price action and on-chain activity might reveal underlying strength.
The on-chain valuation metrics offer a nuanced view of the situation.
- The NVT ratio (with circulation) is exploding, suggesting short-term overvaluation.
- However, the MVRV Long/Short Difference remains above 12.36%, showing that long-term investors still maintain significant unrealized gains.
Decisive Days Ahead for Ethereum
In summary, Ethereum faces a crucial test, torn between historical selling pressure, positive on-chain indicators, and the resilience of its long-term holders. The key objective : reclaiming $3,950 to validate a bullish breakout.
It remains to be seen whether buyers will manage to propel ETH toward new highs, or if recent selling waves will lead to a more pronounced correction. Ethereum finds itself at a pivotal moment, between support and resistance.

