

XRP: Double Bottom and Major Rebound Potential
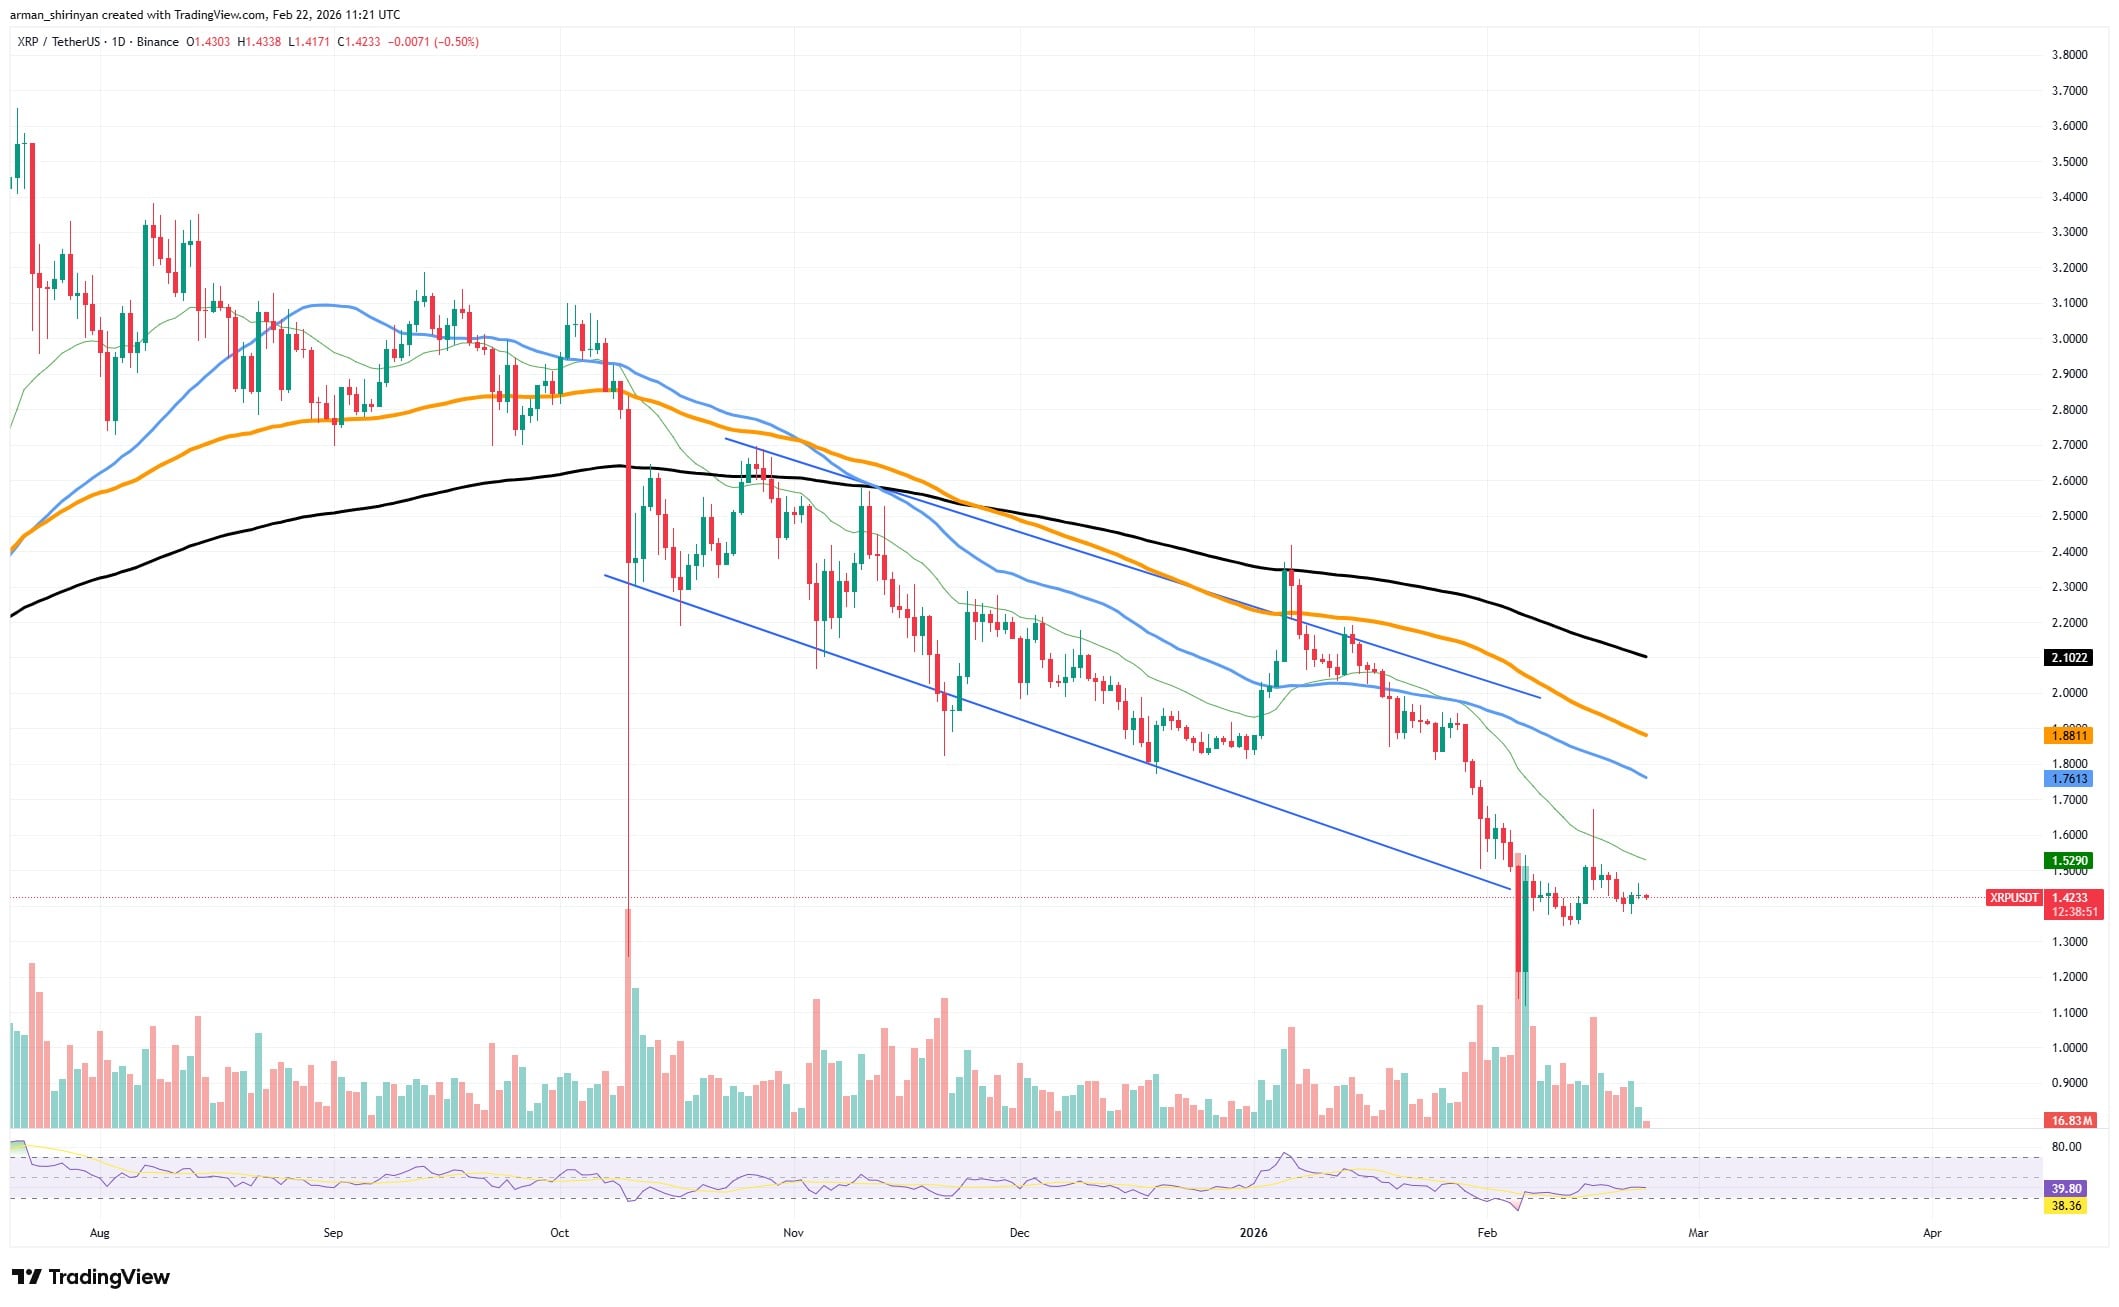
XRP is currently forming a solid double bottom around $2.10, a reversal pattern often signaling a shift in momentum. This technical structure suggests possible exhaustion of selling pressure following the correction that began earlier this year.
Validation will require a clean break of the neckline located around $2.40. A confirmed breakout with volume could open the path toward $2.70–$2.80, offering an attractive risk/reward ratio for long positions.
Technical indicators support this scenario: RSI emerging from oversold territory, MACD showing bullish convergence, and the 50-day moving average acting as potential support. The psychological threshold of $2.50 will be crucial for confirming momentum.
Bitcoin and Shiba Inu: Critical Levels and Waiting Phase
Bitcoin is trading on a key support between $94,000 and $95,000, a true pivotal zone for the market. A break below this level could accelerate the decline toward $88,000, while a solid bounce would reignite momentum toward $98,000, then $100,000.
Volatility is compressing and volumes are declining, a typical signal of an imminent directional move. However, on-chain data shows discreet whale accumulation, suggesting a bullish medium-term outlook despite current tension.
Meanwhile, Shiba Inu remains stuck in a tight range between $0.000020 and $0.000023. This prolonged consolidation is preparing for an explosive move, but only a clear bullish or bearish breakout will provide the directional signal. Patience and discipline remain essential.
👉 Join our free private group and benefit from trades by a professional trader to generate profits all year long.
Related Articles:

