

Technical Consolidation Carrying Bullish Signals
Ripple (XRP) currently shows a price of $2.42, registering a gain of 0.62% over the past 24 hours. This positive intraday performance contrasts with a weekly decline of 0.83%, illustrating the ambivalent nature of current market sentiment. This consolidation phase, far from insignificant, is part of a technical dynamic that analysts are monitoring with particular attention.
The current price zone represents a point of equilibrium where buyers and sellers clash within a relatively narrow range. This technical configuration, known as volatility compression, often precedes significant price movements. Experienced traders recognize in this pattern a possible phase of institutional accumulation.
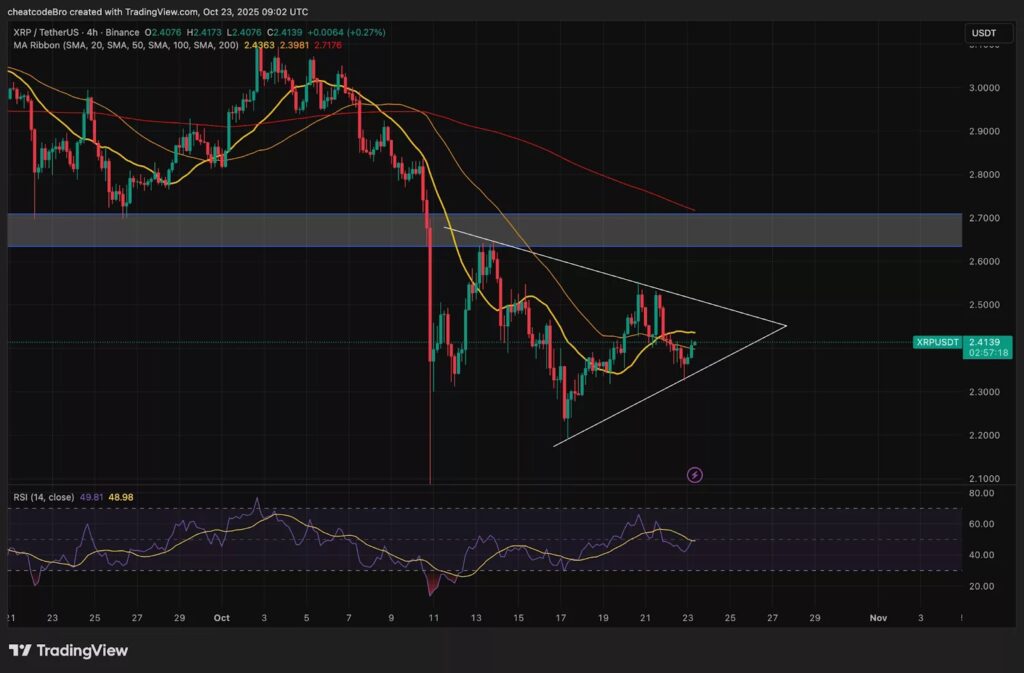
The support levels around $2.35 have demonstrated remarkable strength during recent trading sessions. Each test of this zone has been accompanied by aggressive buying, suggesting robust underlying demand. Conversely, the immediate resistance sits around $2.50, a critical psychological threshold whose breakout could catalyze a wave of buying.
Trading volume remains a determining indicator to validate a potential breakout. On-chain data shows progressive accumulation by large holders, a signal generally interpreted as bullish by technical analysts. This whale activity occurs as the global cryptocurrency market goes through a period of macroeconomic uncertainty.

XRP Fundamentals Support the Bullish Scenario
Beyond chart analysis, XRP fundamentals continue to strengthen. The growing adoption of RippleNet in cross-border payment corridors reinforces the real-world use case for the token. Several financial institutions have recently announced their integration of Ripple technology, fueling optimism among long-term investors.
The regulatory context, long a source of uncertainty for XRP, is gradually becoming clearer. Recent legal developments have restored confidence among institutional investors who had adopted a cautious approach. This regulatory clarification could unlock significant capital flows toward the asset.
Market metrics also reveal a decrease in selling pressure on exchange platforms. The supply-demand ratio is gradually improving, while withdrawals to personal wallets are increasing, indicating that holders are adopting a medium-term hold strategy rather than short-term speculative trading.
Which Levels to Watch to Anticipate the Next Movement?
Technical traders identify several critical zones for upcoming sessions. A confirmed breakout above $2.50 with substantial volume would open the path toward the $2.75 target, and potentially $3.00. These projections are based on Fibonacci extensions and historical XRP price action precedents.
Conversely, a loss of support at $2.35 would invalidate the short-term bullish scenario and could lead to a pullback toward $2.15. Stop-loss orders for long positions generally concentrate below this level, which could amplify any downward movement through a cascade effect. Risk management remains paramount in this volatile environment.
Technical oscillators like the RSI display neutral values, leaving room for movement in either direction. The MACD shows signs of bullish convergence on the 4-hour timeframe, an indicator that day traders are watching closely to time their position entries.
On the same topic:

