

A Technical Plunge That Catches Investors Off Guard
XRP is currently showing a 7% decline that has caught the entire crypto community’s attention. This correction comes in a paradoxical context: while the institutional infrastructure around Ripple’s token continues to expand, short-term capital flows have turned negative. Sell volumes have increased significantly on major exchanges, reflecting a sudden shift in market sentiment.
Chart analysis reveals a clear break of major technical support located around $2.10. This breakdown was accompanied by a marked increase in volumes, a signal often indicative of continued bearish momentum. Technical indicators like the RSI and moving averages are converging toward a short-term bearish consolidation scenario.
Professional traders are now watching the $1.80 zone as the next major level of interest. This psychological threshold also corresponds to a horizontal support that held during previous corrections. Should this zone give way, XRP could face heightened volatility and cascade liquidations.

The Institutional Enigma: Why This Divergence?
The contrast between XRP’s institutional fundamentals and its recent performance is striking. Banking partnerships are multiplying, cross-border payment solutions based on the Ripple network are gaining ground, and yet the price continues to fall. This divergence illustrates a fundamental principle of crypto markets: short-term price action rarely reflects medium-term institutional developments.
Several hypotheses are circulating among analysts. The first concerns massive profit-taking after the recent rally that propelled XRP above $2.50. Investors who accumulated at lower prices likely decided to secure their gains. The second explanation points to a general cooling of sentiment across the entire crypto market, where even solid projects are experiencing technical corrections.
On-chain data shows a redistribution of tokens from long-term holding wallets to exchanges. In total, more than 500 million XRP have been sold by whales in the past 5 days.
Strategies and Levels to Watch for the Coming Sessions
The next few days will be decisive for XRP’s trajectory. The $1.84 level represents the bullish trendline formed on higher timeframes. If this price is lost, XRP exposes itself to a drop toward the next support at the Fibonacci retracement level around $1.56.
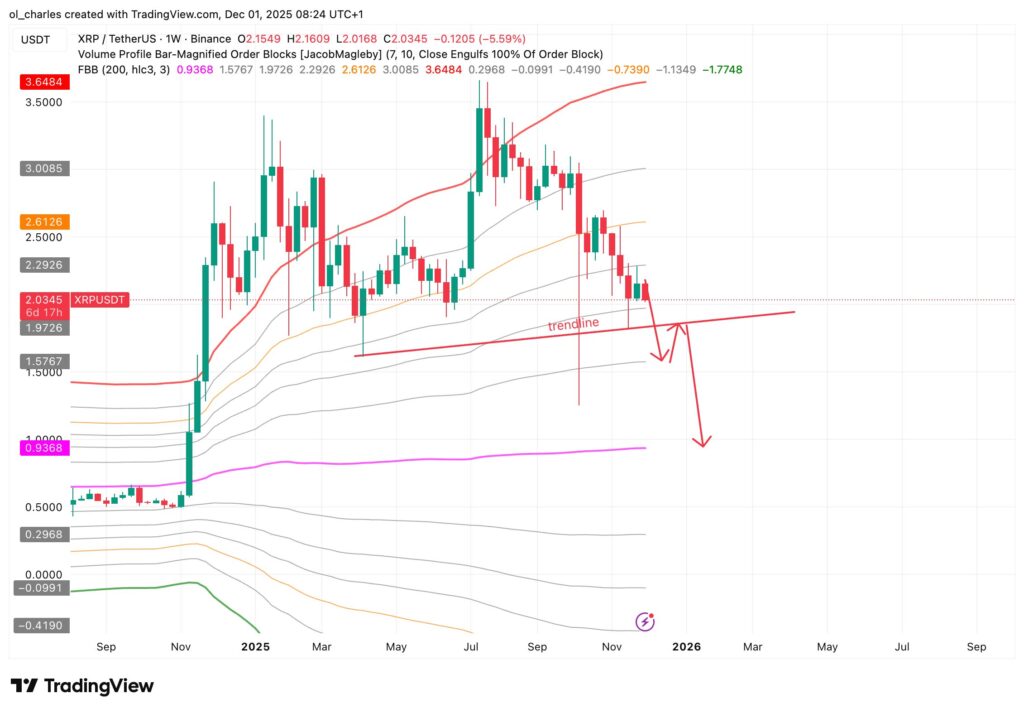
Similarly, if this level fails to hold, it will target the middle Fibonacci band at approximately $0.96. This drop below $1 represents a 50% crash over the coming weeks. However, XRP at $0.96 will offer an opportunity to enter the market at an optimal level for a short to medium-term bounce.
Some prefer waiting for confirmation of a bounce before initiating long positions, while others are waiting for a breakout below $1.80 to start entering short positions.
Risk management is essential in this uncertain context. Using tight stop-losses, properly sizing positions, and avoiding excessive leverage are golden rules that all seasoned analysts emphasize. The market remains volatile, and XRP’s technical structure requires vigilant monitoring of key support and resistance levels in the coming sessions.
Related Articles:

