

$2.50 Support Breakdown Triggers Cascade of Liquidations
The downward break of the $2.50 level represents much more than a simple price movement for XRP. This threshold constituted a major technical support observed for several weeks by market analysts. The breakdown of this zone immediately triggered a wave of selling, amplifying the bearish pressure on the asset.
The explosion in trading volume, with an increase of 158%, confirms the intensity of this movement. This spectacular rise in exchanges reflects massive investor participation, whether from automatically liquidated long positions or bearish traders taking new short positions. In trading terminology, this is known as a breakdown accompanied by strong volumetric confirmation.
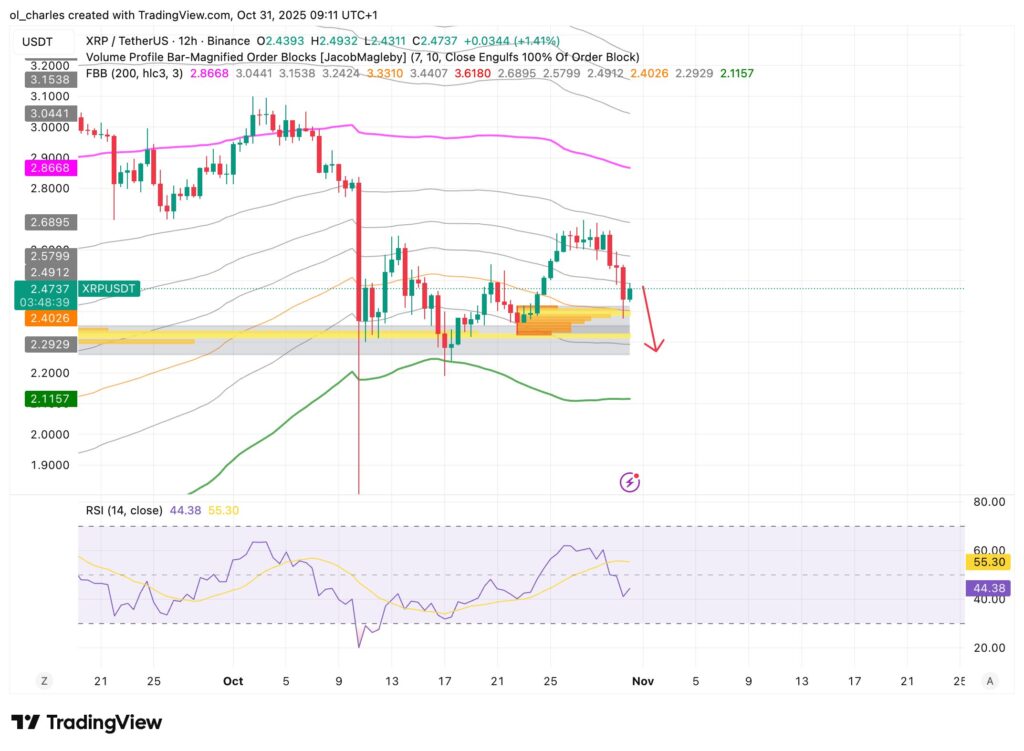
XRP is now trading at $2.47, a price level observed in mid-January. The $2.35-$2.40 zone is a demand area that offered a temporary bounce for XRP from Thursday evening to Friday. Conversely, a continued decline could drive the asset toward more concerning levels below $2.30.
The next crucial support is at $2.27. The RSI on the 12H and 6H timeframes has not reached the oversold zone, which still leaves room for further downside.
Buy XRP during the dip and maximize your gains with the AI-powered GetAgent bot from Bitget. Also take advantage of the exclusive $10 bonus offer here:

Technical Factors Behind This Bearish Dynamic
Technical analysis reveals several converging signals that explain this sharp decline. XRP’s RSI (Relative Strength Index) was already showing signs of weakness before this breakdown, suggesting a weakening of the previous bullish momentum. Short-term moving averages have also shifted into a bearish configuration, reinforcing the negative sentiment.
The price structure shows that XRP failed to maintain the gains accumulated during the recent rally phase. This inability to maintain elevated levels demonstrates selling pressure exceeding buying demand. Market makers appear to have withdrawn their liquidity above $2.50, facilitating the rapid price descent.
The overall market sentiment is also influencing this trajectory. Major altcoins are currently undergoing a consolidation phase following the bullish movements of the year-end. XRP, despite its unique positioning in the crypto ecosystem, is not immune to this capital rotation.
Outlook and Levels to Watch for Traders
Traders must now identify potential reaction zones to adjust their strategies. The first level to watch is between $2.25 and $2.32, which corresponds to a former support turned resistance during previous movements. A technical bounce from this zone remains possible if buyers step in.
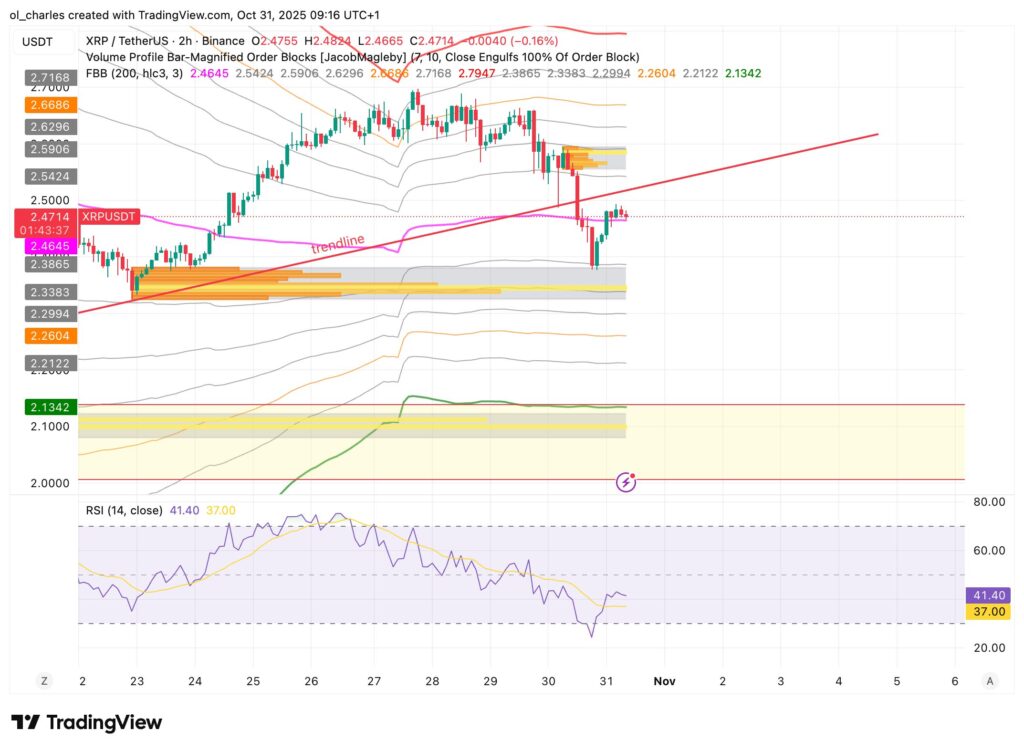
To consider a bullish reversal, XRP would need to reclaim the threshold and the liquidated trendline at $2.50 with significant volume. This level, now transformed into resistance, will constitute a major psychological test for the bulls. Without this recovery, the bearish trend could become firmly established.
If $2.25 is lost, the zone between $2.08 and $2.15 is the next area to watch. This represents the last support before a more dramatic fall below $2.00.
On the same topic:

