

Is Bitcoin’s Key Support Ready for a Massive Breakout?
Currently in a consolidation phase within a zone ranging from $69,540 to $71,300, the king of cryptos surprised the market with a sudden rally. This violent move toward $73,000, occurring after the announcement of a deal between Trump and Iran, caused an absolute bloodbath for short sellers. In total, a massive volatility event worth $596 million wiped out over 120,000 reckless traders, confirming the strength of the current trend.
This brutal liquidation of short positions demonstrates the underlying resilience of the market against selling pressure. Technically, BTC has managed to break out of its compression zone. The $72,000 level is now acting as a major psychological resistance.
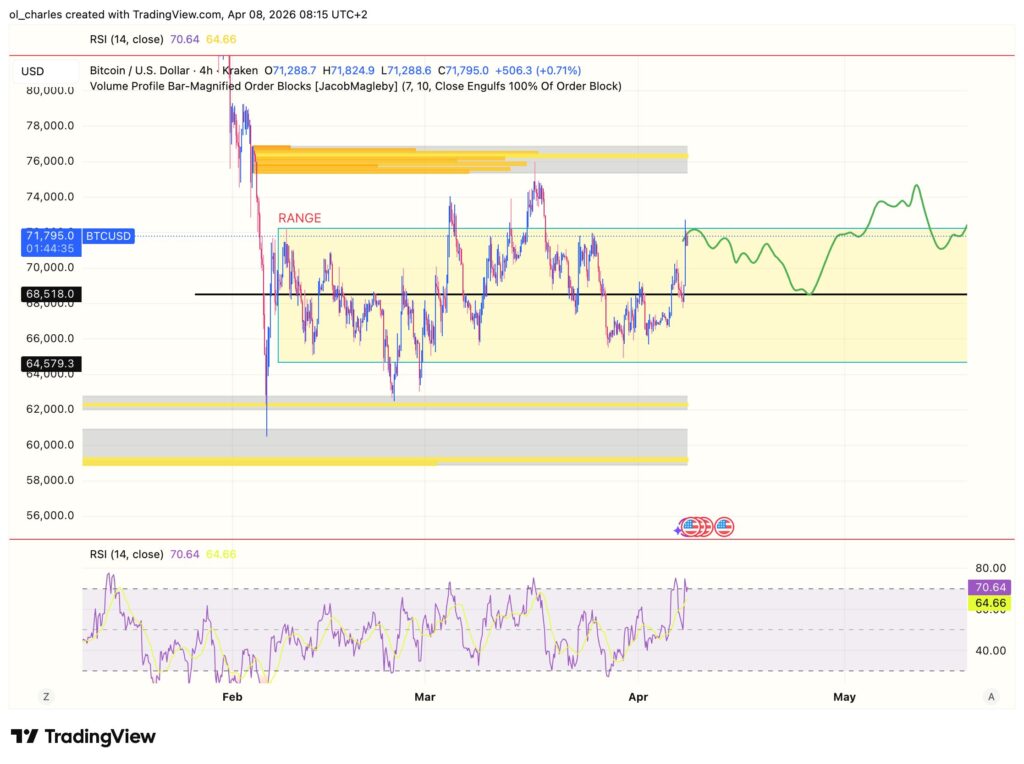
Although this pump is promising, technical analysis might indicate a local top at $72,700. Indeed, not only has Bitcoin reached the top of its range and formed a swing failure pattern (failing to break out of the range high and falling back inside), but BTC is also printing a bearish divergence on its 4H RSI. With this 4H RSI in overbought territory, BTC could trade sideways or even retest the mid range at $68,000 before potentially targeting the $74,000 to $78,000 zone in the coming weeks.
How High Can the Price of Bitcoin (BTC) Soar?
The burning question on everyone’s lips is whether this breakout is the prelude to a new bull run. According to on chain analysis, breaking and closing above $73,000 is just the first step. The true catalyst for the bull market lies between $78,000 and $82,000, a highly anticipated technical and psychological level.
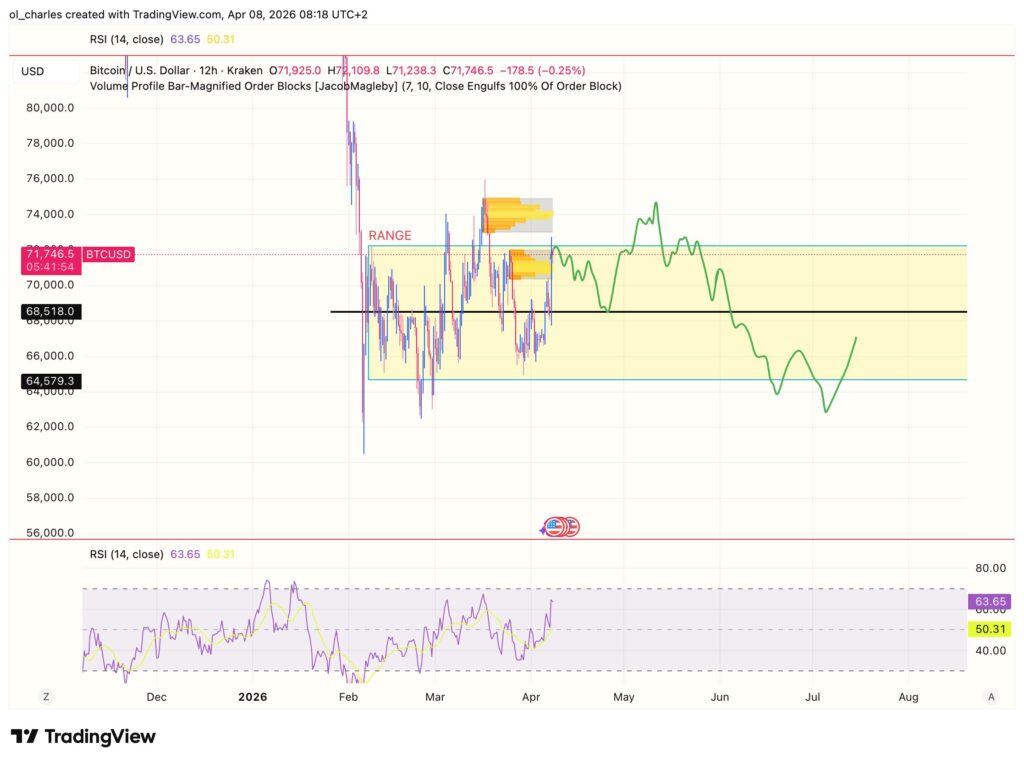
For now, Bitcoin is facing two 12 hour order blocks and is sitting at the top of its range. Caution and shorting should be favored here as long as it has not printed a daily close above $73,000.
From a range trading perspective, Bitcoin could very well retest $75,000 by early May before heading back down to seek its lows around $62,000 in the coming months.
In fact, the trader Killa recently announced closing his short and placing a buy order at $62,000. This tweet sparked a lot of conversation as the potential direction of Bitcoin remains highly divisive.
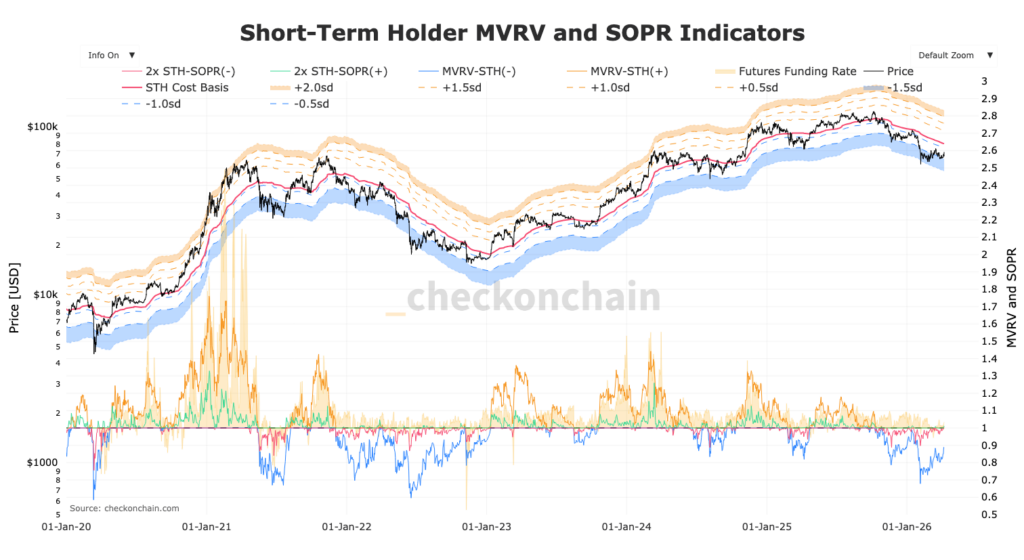
Looking at the Bollinger chart for STH SOPR and MVRV, Bitcoin could retest $76,264 in the coming weeks before retracing and consolidating above $55,000. Indeed, this analysis stems from comparing the Bitcoin price action during the 2022 bear market, which retested the dotted blue MVRV line before consolidating above the blue band.
$80,000 as the Final Barrier Before the New Bull Run
This chart also highlights $80,000 as the ultimate barrier to overcome (the red line representing the average purchase price of STH). Sustaining above this level has historically signaled the return of a bullish trend.
But for now, Bitcoin remains stuck in a range and below this crucial level. With HTF bearish order blocks to break through, it is essential to remain cautious.
While volatility remains extreme, the coming days will be decisive in confirming the market direction. Traders will need to navigate carefully, as a breakout above $80,000 could mark the beginning of a parabolic surge to a minimum of $150,000 for Bitcoin.
Sources:
Related Articles:

