Bitcoin: This signal has predicted every Bull Run, is another explosion coming?
The monthly MACD for Bitcoin is turning bullish! Discover the rare signal that has preceded every major bull run. Could a BTC price explosion be next?


The monthly MACD for Bitcoin is turning bullish! Discover the rare signal that has preceded every major bull run. Could a BTC price explosion be next?
The crypto market is going through a period of intense compression, and technical analysts have their eyes glued to a specific indicator. On the Bitcoin monthly chart, the MACD has just made a shift that few investors usually monitor: the histogram has flipped from deep red to light pink. For Merlijn The Trader, an analyst followed by hundreds of thousands of traders on X, this color change is not just cosmetic. It is a momentum reversal signal that has occurred exactly three times in Bitcoin’s history: in 2015, 2019, and 2023. Following each occurrence, a major bull run ensued without exception.
The MACD indicator measures the convergence and divergence of two exponential moving averages. On the monthly timeframe, each signal carries considerable weight: a single candle represents 30 days of price action. The shift from red to pink indicates that selling pressure is exhausting without buyers having taken full control just yet. It is the intermediate phase, where the market catches its breath before a potential directional resumption.
What Merlijn The Trader’s technical analysis highlights is the consistency of the pattern across four cycles. Each time, Bitcoin was trading inside a long-term compression triangle, characterized by lower highs and a strongly held support. The MACD reversal to pink preceded the bullish breakout from the triangle, followed by an explosion to a new ATH. In 2023, BTC was still trading below $20,000 when this signal flashed. It then surged past $100,000 in 2025, confirming the historical predictive value of this setup.
However, the analyst tempers short-term enthusiasm. His scenario does not call for an immediate rally. According to Merlijn The Trader, the current setup faithfully replicates previous cycles, and those all included a severe final retracement before the real takeoff. This final move would serve to liquidate overleveraged positions and establish a solid floor, forming the technical foundation for the next bull cycle.
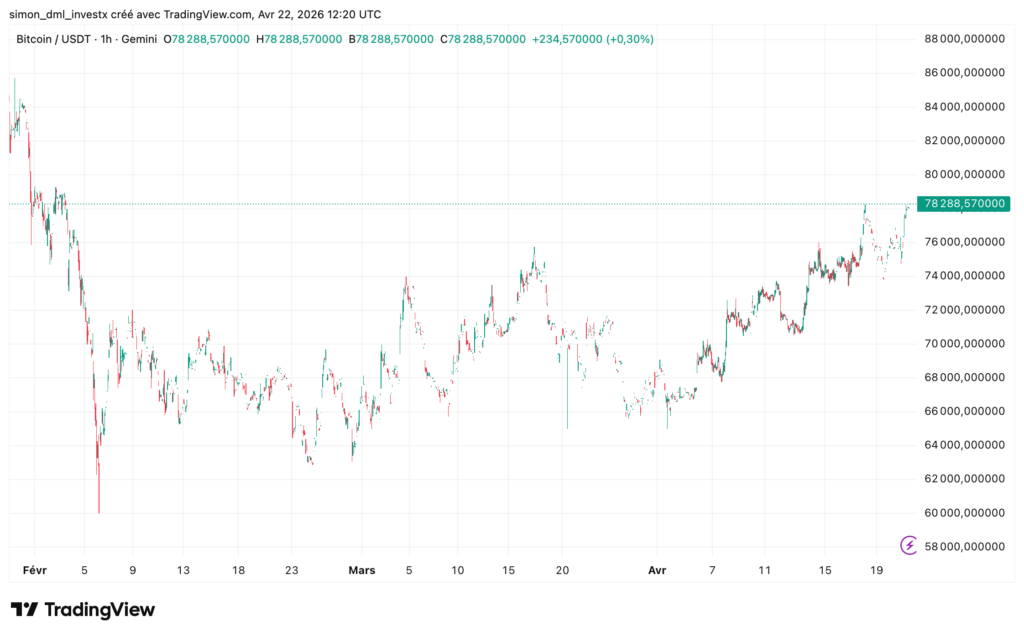
Bitcoin is currently trading around $75,000, in a technical compression zone that the analyst describes as a “springboard.” A correction to lower levels cannot be ruled out before the triangular structure resolves to the upside. Traders accustomed to support and resistance trading will recognize this type of setup: it is precisely in these zones of maximum compression that the most asymmetric entries present themselves, but also the most costly traps for those who anticipate the move too early. A Fibonacci retracement to the 0.618 and 0.786 levels remains something to watch closely.
This technical signal arrives in a macro context that reinforces it. US spot Bitcoin ETFs have been recording steady net inflows for several weeks. During the week of April 14 to 18, 2026, flows reached nearly $996 million, including $663.9 million on Friday, April 17 alone, marking the highest level since January. On April 20, net inflows into BTC ETFs reached an additional $238 million. Over the first two days of 2026, spot ETFs had already raked in $1.17 billion, a clear sign that institutional demand remains structurally solid.
These flows reflect a demand that neither bearish price pressure nor macro volatility has managed to erode. Whales and large funds continue to accumulate via these regulated vehicles, which structurally supports the price floor. As long as these inflows are maintained, the scenario of a lasting collapse remains highly unlikely according to the on-chain data available on Checkonchain.
This is the question every investor is asking when faced with this type of rare setup. The MACD signal is bullish in the long term, ETF flows are positive, and the historical pattern points to a new peak. But the risk of a final drawdown before the breakout is real and well-documented in previous cycles, with drops sometimes reaching 30 to 40% before the actual takeoff.
For those considering buying Bitcoin, risk management relies on position sizing and staggered entry levels rather than going all-in on a single technical signal. The principles of money management remain the absolute priority in this type of configuration. Our Bitcoin forecast page tracks the evolution of price targets in real time. What the data confirms is this: when this signal has triggered in the past, those who respected the structure captured the most significant moves of the cycle. Those who ignored the compression paid a heavy price.
Sources:
Related Articles:

Crypto analyst with over 7 years of trading experience and a strong background in the iGaming and cryptocurrency industries, I cover crypto news with a rigorous yet accessible approach. Passionate about blockchain since 2019, I have published more than 1,200 articles and guides on cryptocurrencies, DeFi, and blockchain, recognized for their reliability and clarity.
Specializing in on-chain trading and whale activity analysis, I decode blockchain flows to anticipate market trends before they become obvious.
One of my articles was cited by Éric Larchevêque, co-founder of Ledger, highlighting the quality and credibility of my analysis.
My goal remains unchanged: to make crypto accessible and understandable for everyone, from beginners to experienced investors.
Follow me on LinkedIn and X to stay updated with my latest insights.
DISCLAIMER
This article is for informational purposes only and should not be considered as investment advice. Trading cryptocurrencies involves risks, and it is important not to invest more than you can afford to lose.
InvestX is not responsible for the quality of the products or services presented on this page and cannot be held liable, directly or indirectly, for any damage or loss caused by the use of any product or service featured in this article. Investments in crypto assets are inherently risky; readers should conduct their own research before taking any action and invest only within their financial means. This article does not constitute investment advice.


Risk Warning : Trading financial instruments and/or cryptocurrencies carries a high level of risk, including the possibility of losing all or part of your investment. It may not be suitable for all investors. Cryptocurrency prices are highly volatile and can be influenced by external factors such as financial, regulatory, or political events. Margin trading increases financial risks.
CFDs (Contracts for Difference) are complex instruments with a high risk of rapid capital loss due to leverage. Between 74% and 89% of retail investor accounts lose money when trading CFDs. You should assess whether you understand how CFDs work and whether you can afford to take the high risk of losing your money.
Before engaging in financial or cryptocurrency trading, you must be fully informed about the associated risks and fees, carefully evaluate your investment objectives, level of experience, and risk tolerance, and seek professional advice if needed. InvestX.fr and the InvestX application may provide general market commentary, which does not constitute investment advice and should not be interpreted as such. Please consult an independent financial advisor for any investment-related questions. InvestX.fr disclaims any liability for errors, misinvestments, inaccuracies, or omissions and does not guarantee the accuracy or completeness of the information, texts, graphics, links, or other materials provided.
Some of the partners featured on this site may not be regulated in your country. It is your responsibility to verify the compliance of these services with local regulations before using them.
