

Is Bitcoin Headed for a Drop to $108,000 ?
The Bitcoin price is currently down 1.5% over the last 24 hours, trading at $111,699 at the time of writing. Bitcoin could be heading toward its higher timeframe trendline at $110,500.
Subsequently, Bitcoin could move toward two key support levels at $109,500 and $108,500 if the $110,500 level doesn’t hold.
Resistance zone at $114,000 in sight for a bullish rally
- If BTC manages to close an hourly candle clearly above $113,200, this could trigger a new bullish impulse.
- A quick retest of the $114,000 zone then seems possible, with momentum potentially favoring buyers (the bulls). The crucial resistance is between $114,100 and $114,400.
- If this threshold is breached, projections estimate a possible test of the next resistance around $115,000 by the end of the week.
Most likely scenario in the short and medium term
On the daily timeframe, Bitcoin remains far from major technical levels, making the daily close crucial for estimating market sentiment :
- A bullish candle above yesterday’s high would signal buyers regaining control.
- Current trading volume remains relatively low, indicating a market seeking clear direction.
For experienced traders, this suggests that a wait-and-see strategy, based on the daily closing of Japanese candlesticks, remains preferable to anticipate what comes next.
In the medium term, trends remain uncertain, with neither camp (buyers or sellers) seeming to have decisive dominance. The low volatility confirms a sideways scenario (range trading) in the key zone of $110,000 to $114,000. This pattern could constitute an accumulation phase before a potential bullish breakout, typical of Bitcoin cycles.
Key indicators to watch on Bitcoin
Here are the levels to monitor in the coming days to refine your investment decisions :
- Upward resistance : $114,400 (psychological and technical threshold)
- Immediate support : $110,500
- Transaction volume : still too low to confirm a convincing breakout
- Daily close : decisive in orienting short-term sentiment
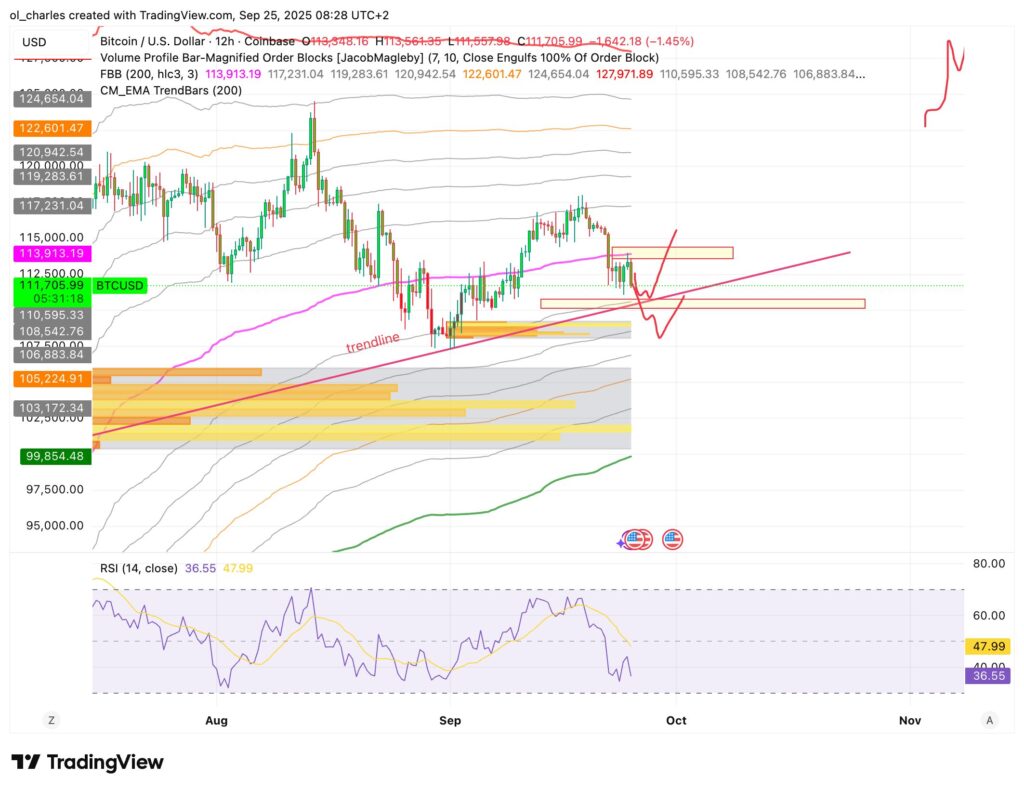
Expert tip : Watch for bullish divergences on RSI and MACD, widely used in analyzing trend reversals on Bitcoin. Also monitor the Volume Profile to identify potential bounce zones and the FBB for supports and resistances.
The Bitcoin price forecast as of September 24 shows a fragile balance between buyers and sellers. For now, Bitcoin is showing concerning signs of weakness.
At this stage, BTC continues to evolve in a correction phase, making each move decisive for the remainder of the cycle. The main watchword for professional investors: strategic caution and technical discipline.
Should you buy BTC ?
Bitcoin is the crypto that offers the lowest risk. In case of a correction, Bitcoin is chosen as a safe haven. Consequently, a rebound toward a new ATH could occur if BTC maintains this zone around $107,000. Here are the steps for a purchase with potential for nearly 30% rebound :
- Create a Bitget account : Go to the Bitget website or download the app. Register with your email or phone number, then complete KYC verification (ID document, 5-10 minutes) to comply with MiCA standards in Europe.
- Deposit funds :
- Bank card : Add via Visa/Mastercard (1-2% fee, instant). Example: €100.
- SEPA transfer : Free, but takes 1-2 days (perfect for larger amounts).
- Crypto : Transfer USDT from an external wallet (fast, minimal fees).
- Funds appear in “Assets” > “Spot Wallet”.
- Buy BTC :
- Go to “Trade” > “Spot”.
- Search for “BTC/USDT”.
- Market buy : Click “Buy”, enter the amount (e.g., €50 = ~0.00044 BTC at $113,199), and confirm for an instant purchase.
- Limit buy : Set a target price (e.g., $112,000 if dip) and wait. Useful for buying low post-expiration.

