

A Historic Divergence: Gold Plummets, Bitcoin Holds Firm
March marks a decisive turning point in the financial markets. While gold has just recorded its fourth consecutive week of decline, Bitcoin maintains a solid consolidation around the symbolic $70,000 mark. This opposing dynamic has dragged the Bitcoin-Gold correlation index down to -0.9, a level not seen since late 2022.
At the time, this extreme decorrelation marked a major bottom for BTC, then valued at $15,600, before triggering a bullish rally lasting over two years. According to CryptoQuant data, this new break in correlation could indicate that investors are turning away from traditional safe havens to accumulate assets with greater upside potential.
On the commodities front, renowned trader Peter Brandt highlighted that gold is currently forming a highly bearish technical pattern called “Nine Red Birds”. This pattern, characterized by nine consecutive daily red closes, has only appeared four times in his entire career. Such a correction in gold could mechanically redirect massive volumes of capital into the crypto market.
The BTC/Gold Ratio Confirms a Bottom: Heading Towards a New Breakout?
The analysis of the BTC/Gold ratio reinforces this extremely positive market sentiment. Renowned analyst Michaël van de Poppe recently highlighted that the current 70% retracement of this ratio perfectly matches the historical bottoms observed during previous 13 to 14 month bearish cycles.
Historically, every drastic drop in this ratio has preceded an explosion in the price of Bitcoin. The declines of 86% in 2014, 83% in 2018 and 76% in 2022 all marked the end of a bear market and the beginning of an aggressive accumulation phase. Today, the stabilization of this ratio suggests that Bitcoin is gearing up to significantly outperform gold in the coming months.
A short term bullish divergence on the BTC/Gold chart also indicates that selling pressure is fading. If this scenario is confirmed, we could witness an imminent breakout. Whales seem to have understood this well, taking advantage of this price zone to massively accumulate tokens before the next bullish impulse.
Can Bitcoin Smash Its ATH in the Coming Weeks?
With an inverse correlation to gold and technical signals flashing green, all eyes are now on the resistance of $73,000. If Bitcoin manages to break free from this friction zone, the lack of major resistance above this level could propel the price into an unprecedented price discovery phase.
The macroeconomic data expected by the end of the month, combined with the growing institutional appetite via Spot ETFs, could act as the perfect catalyst. While gold shows historic signs of weakness, the narrative of Bitcoin as “digital gold” has never been more relevant for attracting capital seeking high performance.
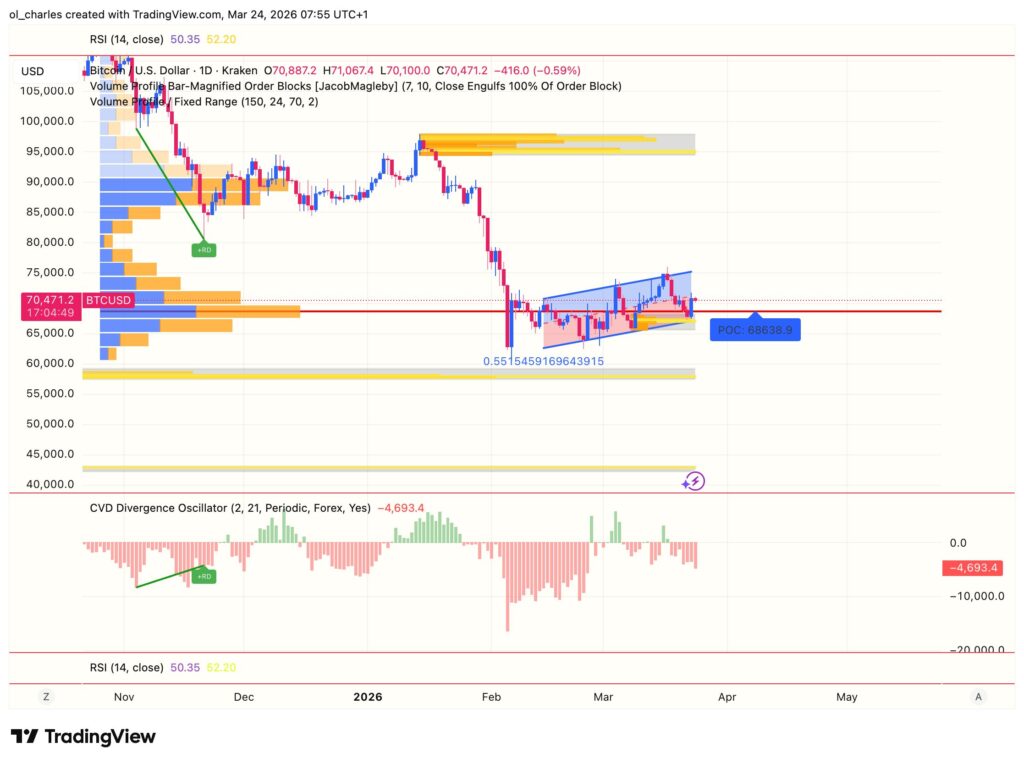
Given this exceptional technical setup and the silent accumulation by large wallets: is this the ideal time to take a position before Bitcoin soars towards $100,000, or will the bearish flag weigh down the price of BTC?
Related Articles:

